Welcome to IgMin Research – an Open Access journal uniting Biology, Medicine, and Engineering. We’re dedicated to advancing global knowledge and fostering collaboration across scientific fields.
Welcome to IgMin, a leading platform dedicated to enhancing knowledge dissemination and professional growth across multiple fields of science, technology, and the humanities. We believe in the power of open access, collaboration, and innovation. Our goal is to provide individuals and organizations with the tools they need to succeed in the global knowledge economy.
IgMin Publications Inc., Suite 102, West Hartford, CT - 06110, USA
This research was conducted to compare the use of lattice towers and polygonal monopods in the electricity grid infrastructure of the National Society of Electricity (SNEL SA) in the Democratic Republic of Congo. In the face of vandalism and increasing energy demand, it is crucial to analyze the security and reliability of the infrastructure. The study used an analytical approach, including geometric assessments and simulations with Impax software to model the performance of the towers. The results showed that monopods offer significant advantages in terms of resistance to vandalism, maintenance costs, and aesthetics. In conclusion, this research highlights the importance of considering monopods as a viable solution to improve the security and performance of electrical infrastructure. The lessons learned indicate that appropriate design choices can reduce economic losses and optimize energy supply.
The introduction of this study begins by providing background information on the challenges facing the National Electricity Company (SNEL SA). Indeed, SNEL SA faces major challenges in securing, guaranteeing reliability, and ensuring a quality supply of electrical energy for its customers. Acts of vandalism targeting its high-voltage transmission infrastructure, such as the theft of essential materials, lead to collapses of pylons and prolonged interruptions of transmission lines [1-7]. With a transmission network that extends over 9,189.46 km, including very high voltage direct current lines of ± 500 kV connecting Inga to Kolwezi, it is crucial to study these phenomena to ensure reliable energy supply, especially in a context where demand reaches nearly 2,000 MW. The research area focuses on the analysis of electrical infrastructures, highlighting the reasons for this choice by the need to improve their security against acts of vandalism. These acts not only represent a threat to the reliability of the network but also a significant economic cost for the company and its users. Mining companies, in particular, adopt monopod towers to counter these acts, highlighting the need for comparative evaluation between monopod towers and lattice towers.
Real problems that require solutions include the vulnerability of lattice towers to acts of vandalism, which lead to service interruptions and high maintenance costs. The research aims to identify these challenges while exploring the advantages of monopod towers, particularly in terms of vandalism resistance and maintenance costs.
The objectives of this research are clear: to technically compare monopod and lattice towers, to identify the specific advantages of monopods, to evaluate the associated costs, and to formulate recommendations for their adoption in the SNEL SA transmission network. This will be accompanied by a study of structural engineering principles and safety standards, as lattice towers, although commonly used, present increased vulnerability.
Finally, the literature review highlights several previous studies on electricity transmission infrastructures while highlighting gaps regarding the specific impacts of vandalism and design choices. For example, a recent study [3] addresses the optimization of tower design without addressing their vulnerability. Similarly, the analysis [5] on the reliability of electrical networks does not distinguish between tower types. These gaps fully justify further investigation to offer practical and innovative solutions to improve the safety and performance of SNEL SA's electrical infrastructures.
Materials and methods
Presentation of the study environment
In this study, we focus on evaluating the issues related to the technique of using monopod towers compared to lattice towers and their costs. For this, we have adopted an analytical approach that starts with the examination of the geometry of monopod towers. This geometry is based on critical electrical distances, such as the distance from the ground, the balance of active conductors, and the distance between phases, as shown in Figure 1. The forces induced in these structures generate internal forces and moments that are calculated in a simplified way on the supports [8-11].
Figure 1: Geometry of the monopod flag supports [8-11]. Note: Espace entre consoles- Space between consoles; Hauteur Sous console- Height Under console; Saillie- Projection; Epure de balancement- Swinging outline.
Figure 1 shows a pylon with brackets. On the left, the space between the brackets and the height under the bracket are indicated, important dimensions for stability. On the right, the projection shows how much the brackets protrude from the pylon. The swing diagram represents the possible movement of the brackets, essential to understanding how the pylon reacts to forces, such as wind, to ensure its safety and strength.
Data collection
We also studied the forces applied to the monopod supports in Figure 2, which are determined by the choice of active conductors, usually supplied by customers and calculated according to national standards [1,2,8-11].
Figure 2: Diagram of forces and moments on monopod flag supports [1,2,8-11].
These forces can be expressed in different ways, notably by means of a mechanical load tree, which takes into account vertical, horizontal, and transverse forces and which is directly entered into a calculation program, as illustrated in Figure 3 [1,4,10,12].
Figure 3: External Load Diagrams Case 3-Combined Wind and Ice and Case 5-Safety Loads-Broken Wire Condition [1,4,10,12].
To assess the safety, reliability, and performance of overhead power lines on a tower, several elements must be considered. First, the span between the supports of the line is crucial, as it influences the distribution of forces exerted on the structure. Second, the conductor diameter, which defines the size of the cable used, has a direct impact on the strength, weight, and load capacity. Furthermore, it is essential to examine the pressures and wind directions for different loading scenarios in order to understand how these factors can affect the structure. The angle of the line, representing its inclination with respect to the horizontal, is also an important parameter to consider [10,12,13].
Conductor breakage conditions are another major concern. These conditions refer to the circumstances under which the cable could break, often due to overload or material fatigue. The methods and practices used during line installation also play a determining role in the performance and durability of the cable. In addition, it is crucial to evaluate the cable tension for all possible loads to ensure that it remains within safe limits [9,12,14].
Considering all these elements, we aim to ensure efficient design and implementation of overhead power lines. Since monopod towers undergo significant deformations, it is imperative to consider the P-Δ effect, which takes into account the instability of the structure, as shown in Figure 4 [1,2,4,5,10,11].
Figure 4: Diagrams of moments and applied forces [1,2,4,5,10,11].
Data analysis
The applied forces and the distances involved in the calculation of moments are expressed by the following equations [1,2,4,10,11].
M = P × ∆ (1)
Or:
➢ M: Moment (or moment of force);
➢ P: Applied force (or load);
➢ Δ: Perpendicular distance (or lever arm).
M1 = T × H × V × d ×W × h × P × ∆ (2)
Or:
➢ M1: Total moment;
➢ T: Tensile force;
➢ H: Height at which the tensile force is applied;
➢ V: Compressive force (or other force);
➢ d: Distance at which the compressive force is applied;
➢ W: Weight (or other force);
➢ h: Height at which the weight is applied;
➢ P: Applied force (or load);
➢ Δ: Perpendicular distance associated with the applied force.
Regarding polygonal sections, they are subject to local deformations when considered as non-compact. To address this phenomenon, we adopt two main approaches. The first is to analyze local deformations, which involves evaluating the effects of loads applied to specific areas of the section, thus identifying potential weaknesses. The second approach focuses on the application of strength criteria, ensuring that the structural integrity of polygonal sections is maintained under various loading conditions [8-11].
We also implemented the ASCE method, which was used to establish relationships between allowable stress and the W/t ratio, where W represents the width of one side of the cross-section and t its thickness in Figure 5 [1,2,8-11].
Figure 5: ASCE method [1,2,8,9,10,11].
A second method, in accordance with EN 50341 in Table 1, is based on Eurocode 3 for non-compact sections of class 4, where the effective section characteristics are calculated using an equation defined as follows [1,2,8-11].
Table 1: Representation of the section according to the Aeff distribution under axial force and Weff under bending moment [1,2,8-11].
(3)
Or:
➢ Nsd: Normal service load (or normal service force);
➢ Aeff: Effective area (or effective section);
➢ Msd: Service moment (or service bending moment);
➢ Weff: Effective moment of resistance (or effective section modulus);
➢ fy: Tensile strength (or yield strength);
➢ γM1: Partial safety factor for materials (or safety factor).
Since monopod towers are more subject to deformation than lattice towers, this raises aesthetic concerns, in particular, the curvature often referred to as “banana shape.” This deformation can be particularly visible when the deformation exceeds the upper diameter of the tower. According to SNEL SA standards, a deformation limit of 6% of the height of monopod towers is imposed for alignment towers, while a limit of 4.5% is set for those subjected to high angles. It is recommended that the deflection, during a second-order analysis at the ultimate limit state, does not exceed 8% of the height of the column above ground level. This attention to deformation is essential to ensure the safety and aesthetics of monopod towers in Figure 6 [1,9,10,12,13].
Figure 6: ASCE method [1,2,8,9,10,11].
In tower design, stresses are evaluated by considering different types of steel. Stresses are calculated by integrating weighting factors and are compared to the yield strength or allowable buckling stress. The use of high-strength steel is crucial to reduce the weight and costs of towers [4,9,12].
To optimize the design of towers, two main strategies emerge: increasing the diameter or the thickness in Figure 7. It is essential to maintain a reasonable ratio between these two dimensions to avoid local deformations. Full-scale tests are performed in accordance with IEC 60652 to validate the calculation methods and manufacturing techniques. These tests consist of subjecting the tower to a load up to its design capacity, measuring the deformations, and comparing them to theoretical values [9,12,14].
Figure 7: Section chain in hexagonal shapes by increasing the diameter or thickness [9,12,14].
To optimize the design of towers, two main strategies are considered: increasing the diameter or the thickness. Increasing the diameter is more efficient because the stress (D²EpRe) and the stiffness (D³EpE) depend on it. However, the weight is proportional to (D*E). It is essential to maintain a balanced ratio between diameter and thickness to avoid local deformations and improve buckling resistance [4,12,13].
Finally, we used the Impax software, a tool developed by Valmont, specifically designed for the design and analysis of electricity transmission pylons. This software, thanks to its finite element method, allows complex calculations to be performed and isostatic and hyperstatic structures to be analyzed [1,9,12,13]. By integrating geometric data and section properties, Impax facilitates the evaluation of pylons' performance, which is essential to ensure the safety and reliability of electrical infrastructures.
Results
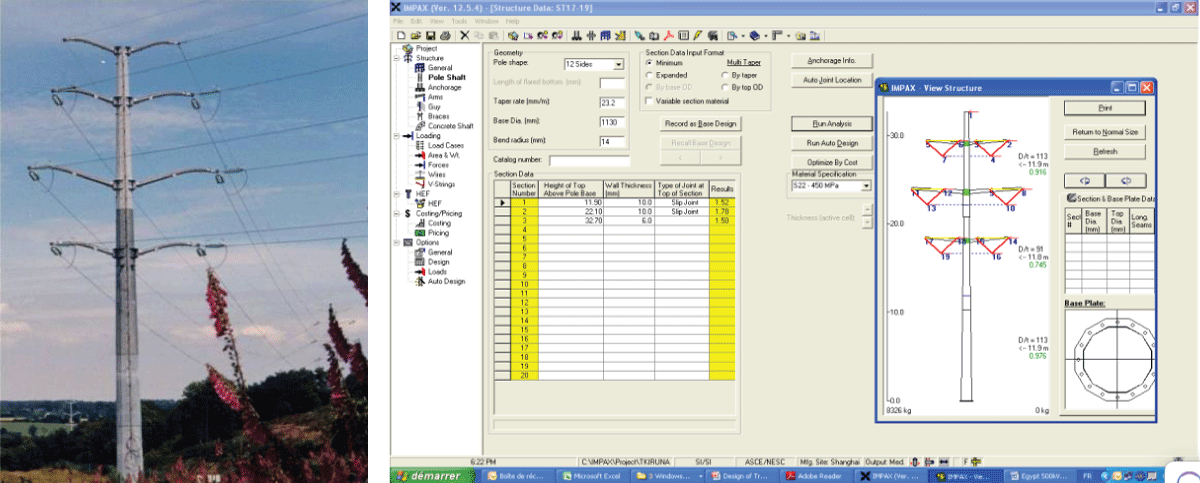
The 40-meter tower, supporting two 220 kV circuits and weighing 42 tonnes, meets a deformation limit of 4.5% for safety. Impax software aids in design and analysis, enhancing visualization and evaluation of mechanical properties.
The Impax software calculates based on full-scale test results. Its diamond-shaped sole optimizes structural stresses. Figure 8 shows an interface analyzing geometric data and 2D/3D representations of double-flag towers.
Figure 8: Double-flag pylon of two 220 kV SNEL circuits and Inserting data from the double-flag pylon into Impax.
Analysis results for tower design, including deflection limits for the ON1H-40, characteristics, connections, and comparisons, are in Tables 2 to 7.
Table 2: Comparison of different deflection limits: Calculations for a tower of type ON1H-40 Height 56.7 meters.
Item
Version 1
Version 2
Version 3
Version 4
Deflection limit
2% Worst Load Case
4% Worst Load Case
2% Every Day Stress
4% Worst Load Case
Top deformation
1125 mm = 2%
2257 mm = 4%
995 mm = 1,8%
2029 mm = 3,6%
Type of tower steel
ASTM gr 65 448 Mpa
ASTM gr 65 448 Mpa
ASTM gr 65 448 Mpa
EN S355
Diameter
2257 mm
2100 mm
2050 mm
2200 mm
Number of elements
7
6
6
6
Thickness
22 mm to 10 mm
15 mm ro 8 mm
15 mm to 8 mm
16 mm to 8 mm
Worst stress ratio
1,94 (steel S235 would be OK)
1,02
1,00
1,01
Design governed by
Deformation
Deformation and stress
Deformation
Deformation
Tower weight
68,7 Tons
41 Tons
40,5 Tons
45,8 Tons
Table 3: Results of the Impax software summary of the design geometry of the pole features of the double flag tower.
Above ground height (m)
Ground ligne Diameter (mm)
1735.00
Pole shaft weight (kg)
15978
Top diameter
1084.18
Shape
12 Sides
Pole taper (mm/m)
19.5000
Table 4: Results of the Impax software summary of the design geometry of connections between sections of the double-flag tower.
Connections between sections
First
Second
Third
Height above ground (m)
11.80
21.10
26.70
Type
Slip Joint
Slip Joint
Slip Joint
Overlap length (mm)
2529
2289
2145
Table 5: Results of the Impax software summary of the design geometry of the dimensions and weight of the sections of the double flag tower.
Overlap length (mm)
First
Second
Third
Fourth
Base diameter (mm)
1735.00
1576.22
1410.05
1314.18
Top diameter (mm)
1504.90
1345.55
1256.35
1084.18
Thickness (mm)
12.0000
11.0000
10.0000
8.0000
Length (m)
11.800
11.829
7.882
11.725
Weight (kg)
5749
4762
2632
2837
Table6: Results of the Impax softwaresummary of the data analysis of the double flag pylon load points.
Load point number
Mounting Height (m)
Load Height (m)
Load Eccentricity (m)
Orientationin XY plans (Degrees)
Force-X(N)
Force-Y(N)
Force-Z (N)
1
36.00
36.10
3.40
0.00
3550
20120
9090
2
36.00
36.10
3.40
180.00
3550
20120
9090
3
33.00
33.20
6.20
0.00
0
0
3500
4
29.00
29.00
0.00
0.00
17640
100010
62100
5
23.00
23.20
7.70
180.00
17640
100010
62100
6
23.00
23.20
7.70
0.00
17640
100010
62100
Table 7: Impax software results of the forces and moments of the double-flag pylon.
Loading case cs 20 distance Force base
Mx (Nm)
My (Nm)
Resultant Mx et My (Nm)
Torsion (Nm)
Shear X-dir (N)
Shear Y-dir (N)
Resultant shear (N)
Axial (N)
36.35
0
0
0
0
0
0
0
0
36.00
5
-1
6
0
7
31
32
822
36.00
4097
-603
4122
-305
7332
40994
41644
19610
34.35
71860
-12727
72978
-306
7363
41140
41193
23562
33.00
127482
-22685
129485
-306
7389
41264
41920
26877
33.00
127513
-50977
137325
752
7426
41440
42100
31679
32.35
154468
-55808
164241
751
7437
41493
42154
33313
30.35
237643
-70721
247943
752
7472
41669
42334
38437
29.00
293995
-80829
308894
752
7500
41900
42467
41992
29.00
293986
-152342
331113
126180
25763
143967
146254
100264
28.35
387588
-169090
422867
126173
25739
143992
146274
102063
26.70
625309
-211596
660136
126173
25772
144154
146439
106546
26.70
625315
-211563
625315
126181
25740
144115
146395
106607
26.35
675771
-220570
675771
126174
25724
144140
146417
108839
24.56
934864
-266792
934864
126181
25774
144480
146761
120154
24.35
964497
-272069
964497
126177
25755
144453
146731
126942
23.00
1159610
-306860
1159610
123177
25788
144617
146898
125737
22.35
1200496
-311687
1200496
122168
62211
349321
354818
264933
21.10
1427584
-352116
1427584
122163
62154
349207
354695
267446
21.10
1864197
-429826
1864197
122161
62184
349358
354849
272015
20.35
1861194
-429795
1864194
122169
62103
349129
354610
278527
18.82
1826116
-476363
1826116
122156
62043
349002
354474
278534
18.35
2661091
-571426
2661091
122157
62026
349069
354537
290951
16.35
2824465
-600433
2824465
122159
61918
348585
354140
293441
14.35
3522090
-724237
3522090
122169
61759
348125
353560
302833
12.35
4218590
-947710
4218590
122169
61580
347434
352849
312558
11.80
4913664
-970835
4913664
61363
61470
347003
352405
322166
11.80
5104530
-1004646
5104530
61260
61480
347055
352458
324654
10.35
5104537
-1004607
5202455
122168
61363
346541
351932
325224
9.27
5607226
-1093557
5712867
122167
61260
346120
351500
339733
8.35
5980795
-1159625
6092178
122168
61167
345724
351093
350745
8.35
6299252
-1215905
6415528
122161
60992
344920
350271
356295
6.35
6989246
-1337813
7116130
122161
60748
343790
349116
367947
4.35
7676946
-1459226
7814399
122162
60489
342557
347856
379677
2.35
8362144
-1580112
8510124
122162
60214
341224
346469
391775
0.35
9044631
-1700474
9203095
122169
60046
340398
345653
403609
0.00
9163771
-1721490
9324067
122169
60046
340398
345654
405575
The 56.7-meter ON1H-40 tower's first version has a 2% deflection limit, the second 4%. Deflection ranges from 1,125 mm to 2,257 mm, with tower weights from 40.5 to 68.7 tons.
The double-flag tower pole is 1,735 mm tall, weighs 15,978 kg, has a top diameter of 1,084.18 mm, and has a taper rate of 19.5 mm/m.
The double-flag tower's connections include a slip joint at 11.80 meters with a 2,529 mm overlap, a 21.10-meter connection with a 2,289 mm overlap, and a 26.70-meter connection with a 2,145 mm overlap, ensuring structural integrity and load management.
The double-flag tower sections include a first section with a 1,735 mm diameter and 12 mm thickness, weighing 5,749 kg; the second section weighs 4,762 kg with a 1,576 mm diameter, ensuring stability and durability.
The double-flag tower's first load point at 36.10 meters shows an eccentricity of 3.40 meters with forces of 3,550 N (Fx), 20,120 N (Fy), and 9,090 N (Fz), critical for stability and design.
At 29 meters, bending moments are 293,995 Nm (Mx) and -80,829 Nm (My). At 22.35 meters, moments reach 1,200,496 Nm (Mx) and -311,687 Nm (My), indicating reinforcement needs, while shear forces at 34.35 meters are 7,363 N and 41,140 N.
The console height is 30 meters for vehicle access. The G4 NT B3x tower measures 6.63 m x 6.63 m (48.40 m²), while the G4 AS B3x and G4 SOS1 B3x measure 7.13 m x 7.13 m (55.921 m²). Monopods range from 3.80 m² to 13.4 m², with lattice towers supporting larger loads (Table 8).
Table 8: Comparison of the Floor Area of Towers (lattice tower and monopole tower) for a 220 kV Double Circuit.
220 kV Double Circuit
Lattice tower
Monopod tower
Monopod versus Lattice in (%)
Height below console
Use
Réf. Tower
Size at GL
Floor area (m²)
Monopod
Size at GL
Floor area (m²)
Floor area
30 m
Low-angle alignment
G4 NT B3x
6,63m x 6,63m
48,40
S2 KNT H6 Y
Diam 1,95
3,80
8%
Medium-angle anchoring
G4 AS B3x
7,13m x 7,13m
55,921
S2 AS H6 Y
Diam 2,98
8,90
16%
High-angle anchoring
G4 SOS1 B3x
7,13m x 7,13m
55,921
S2 AS H6 Y
Diam 3,66
13,4
24%
160,24
26,10
16%
Tubular monopod towers, 1 to 2 meters in diameter, suit suburban areas, installed in half a day to a day. Lattice towers require 10 m x 10 m space and take up to a week to install. Monopods cost 1.25 k€ per kilometer, while lattices cost 1 k€ as shown in Table 9.
Table 9: Comparison between Tubular Monopole Towers and Lattice Towers.
Monopod (tubular) towers
Lattice towers
Aesthetics
Utilities
Location
Suburban areas
Campaign
Floor area
Diameter 1 m to 2 m
Square 10 m x 10 m
Installation
½ to 1 day
1 week
Number of pieces
50
> 1000 (with bolts)
Typical weight
14 tons (3T to 30 T 90 kV)
10 tons
Resist Terrorism
No monopods
Vandal-resistant (South Africa)
No
Avalanche-proof (Norway, Iceland)
No
Cost of complete line per km (ratio)
1.25 k€/km
1 k€/km
Discussion
The ON1H-40 tower imposes a deformation limit of 2% for the first version and 4% for the second. Previous studies [4] confirm that stricter deformation limits promote stability. A hypothesis test could be necessary to assess whether the impact of these limits on performance is significant.
The double flagpole is 1735 mm tall and has a 12-sided shape to improve strength. Research [8] shows that this design optimizes resistance to torsional forces. Further analysis could test the robustness of this configuration.
Slip joint connections are essential for the flexibility and stability of the tower. Work [15] highlights that such connections improve overall performance. A hypothesis test could analyze the impact of these connections on the durability of the tower.
Tower sections vary in weight and diameter, influencing overall stability. A study [12] suggests that cross-section optimization can reduce weight while maintaining strength. A hypothesis test could validate the effectiveness of this approach.
The applied loads present significant forces, requiring detailed evaluation. Research [13] confirms that poorly distributed loads compromise stability. A hypothesis test could examine the effect of loads on the structure.
The measured bending moments show critical values, making the use of adequate materials imperative. Studies [14] reveal that appropriate materials can enhance strength. A hypothesis test could evaluate the effectiveness of these materials under load.
Tower design, with precise specifications, is crucial for safety. Research [4] indicates that monopods, although more expensive, are aesthetically pleasing. A comparative analysis could test the effectiveness of monopods versus lattice towers in different contexts.
The results of the different analyses highlight the importance of design, materials, and installation methods in ensuring the safety and performance of towers. Additional hypothesis testing could strengthen the validity of the conclusions and guide future practices in the design of similar structures.
Conclusion
This comparative study on the use of lattice towers versus polygonal monopods in the SNEL SA high-voltage transmission network addressed several hypotheses formulated at the outset. The analysis revealed that monopod towers offer significant advantages in terms of safety, reliability, and maintenance, thus meeting the main objective of this research: to minimize the impact of vandalism on electrical infrastructure. The results show that monopod towers, thanks to their compact and aesthetic design, allow for rapid installation and reduce maintenance costs over several years. In addition, their increased resistance to vandalism, as well as their flexibility of installation in urban environments, make them a viable alternative to lattice towers, which are often vulnerable to theft and damage. The cost assessment also revealed that, although the cost of a kilometer of line is slightly higher for monopods (€1.25k/km compared to €1k/km for lattice towers), the initial investment is offset by substantial savings in maintenance and superior durability. This finding reinforces the idea that the choice of a tower type must take into account not only the immediate construction costs but also the long-term costs. By relating these results to previous studies on electricity transmission infrastructure, it appears that the phenomenon of vandalism is not isolated to SNEL SA. Other electricity networks around the world face similar challenges, highlighting the need to adopt innovative and sustainable solutions. These findings suggest that the increasing adoption of monopod towers could have a positive impact on the reliability of electricity networks in various contexts. In summary, this research demonstrates the need for an analytical approach to assess tower design choices in the context of electrical infrastructure safety and performance.
Recommendations
The coherence between the problem, objectives, results, and discussion reinforces the validity of this study and paves the way for practical recommendations for SNEL SA and other companies in similar contexts. The adoption of monopod towers could not only improve infrastructure safety but also contribute to a more efficient and sustainable management of electricity transmission networks.
Léon MM. Comparative Analysis of Lattice Pylons and Polygonal Monopods in the SNEL SA Electricity Network. IgMin Res. March 03, 2025; 3(3): 115-122. IgMin ID: igmin291; DOI:10.61927/igmin291; Available at: igmin.link/p291
1Regional School of Water (ERE), University of Kinshasa (UNIKIN), Kinshsasa, Democratic Republic of the Congo
2President Joseph Kasa-Vubu University, Polytechnic Faculty, Boma, Democratic Republic of the Congo
Address Correspondence: Mwanda Mizengi Léon, Regional School of Water (ERE), University of Kinshasa (UNIKIN), Kinshsasa, Democratic Republic of the Congo, Email: [email protected]
How to cite this article: Léon MM. Comparative Analysis of Lattice Pylons and Polygonal Monopods in the SNEL SA Electricity Network. IgMin Res. March 03, 2025; 3(3): 115-122. IgMin ID: igmin291; DOI:10.61927/igmin291; Available at: igmin.link/p291


 スキャンしてリンクを取得
![Geometry of the monopod flag supports [8-11]. Note: Espace entre consoles- Space between consoles; Hauteur Sous console- Height Under console; Saillie- Projection; Epure de balancement- Swinging outline.](https://www.igminresearch.com/articles/figures/igmin291/igmin291.g001.png)
![Diagram of forces and moments on monopod flag supports [1,2,8-11].](https://www.igminresearch.com/articles/figures/igmin291/igmin291.g002.png)
![External Load Diagrams Case 3-Combined Wind and Ice and Case 5-Safety Loads-Broken Wire Condition [1,4,10,12].](https://www.igminresearch.com/articles/figures/igmin291/igmin291.g003.png)
![Diagrams of moments and applied forces [1,2,4,5,10,11].](https://www.igminresearch.com/articles/figures/igmin291/igmin291.g004.png)
![ASCE method [1,2,8,9,10,11].](https://www.igminresearch.com/articles/figures/igmin291/igmin291.g005.png)
![Representation of the section according to the Aeff distribution under axial force and Weff under bending moment [1,2,8-11]..](https://www.igminresearch.com/articles/figures/igmin291/igmin291.t001.png)
![Diagram of the arrow of a pylon under tension [1,9,12,13].](https://www.igminresearch.com/articles/figures/igmin291/igmin291.g006.png)
![Section chain in hexagonal shapes by increasing the diameter or thickness [9,12,14].](https://www.igminresearch.com/articles/figures/igmin291/igmin291.g007.png)


![Geometry of the monopod flag supports [8-11]. Note: Espace entre consoles- Space between consoles; Hauteur Sous console- Height Under console; Saillie- Projection; Epure de balancement- Swinging outline.](https://www.igminresearch.jp/articles/figures/igmin291/igmin291.g001.png)
![Diagram of forces and moments on monopod flag supports [1,2,8-11].](https://www.igminresearch.jp/articles/figures/igmin291/igmin291.g002.png)
![External Load Diagrams Case 3-Combined Wind and Ice and Case 5-Safety Loads-Broken Wire Condition [1,4,10,12].](https://www.igminresearch.jp/articles/figures/igmin291/igmin291.g003.png)
![Diagrams of moments and applied forces [1,2,4,5,10,11].](https://www.igminresearch.jp/articles/figures/igmin291/igmin291.g004.png)
![ASCE method [1,2,8,9,10,11].](https://www.igminresearch.jp/articles/figures/igmin291/igmin291.g005.png)
![Diagram of the arrow of a pylon under tension [1,9,12,13].](https://www.igminresearch.jp/articles/figures/igmin291/igmin291.g006.png)
![Section chain in hexagonal shapes by increasing the diameter or thickness [9,12,14].](https://www.igminresearch.jp/articles/figures/igmin291/igmin291.g007.png)
![Representation of the section according to the Aeff distribution under axial force and Weff under bending moment [1,2,8-11].](https://www.igminresearch.jp/articles/figures/igmin291/igmin291.t001.png)