Welcome to IgMin Research – an Open Access journal uniting Biology, Medicine, and Engineering. We’re dedicated to advancing global knowledge and fostering collaboration across scientific fields.
Welcome to IgMin, a leading platform dedicated to enhancing knowledge dissemination and professional growth across multiple fields of science, technology, and the humanities. We believe in the power of open access, collaboration, and innovation. Our goal is to provide individuals and organizations with the tools they need to succeed in the global knowledge economy.
IgMin Publications Inc., Suite 102, West Hartford, CT - 06110, USA
The International Panel on Climate Change (IPCC) published a lengthy report on climate change in early 2023. This report hypothesizes five potential scenarios of greenhouse gas emissions from 2015 to the end of the century (2100) and estimates the global average temperature gain in the year 2100 from the mid-1800s for each scenario. The method of calculation in the IPCC report is obscure. The results are merely stated.
The present paper provides a clear method for estimating the temperature gain each year from 2015 until 2100, along with yearly estimates of ppm of CO2. To facilitate the calculations, a set of scenarios of future emissions was chosen that is analogous to the scenarios used by the IPCC but is more amenable to computation.
The basic assumption in this paper is that most of the temperature gain from the mid-1800s to 2015 (1.15 C – as reported by the IPCC) was due to rising CO2 concentration in the atmosphere and a relationship is thereby derived between warming and gigatons of CO2 emitted for the period: 1800s to 2015. If it is assumed that the amount of warming per gigaton CO2 from the past persists into the 21st century, then future warming in the 21st century can be estimated for any assumed future scenario of CO2 emissions.
This paper provides a simple and clear estimate of yearly CO2 ppm and temperature rise from 2015 to 2100 since the 1800s for a set of scenarios that cover the likely range of future emissions.
A question of crucial importance for mankind is: how much global warming should be expected for any future scenario of global greenhouse gas emissions? While there have been several attempts to make such predictions [11S. Government. The Fifth National Climate Assessment. https://nca2023.globalchange.gov/.-44Stanford University. Earth likely to cross critical climate thresholds even if emissions decline, Stanford study finds. 2023. https://news.stanford.edu/stories/2023/01/ai-predicts-global-warming-will-exceed-1-5-degrees-2030s/.], the International Panel on Climate Change (IPCC) carried out the most comprehensive investigations of this question. The IPCC published lengthy reports on their predictions of future climate change in 2023 and 2024 [55AR6 Synthesis Report: Climate Change 2023. https://www.ipcc.ch/report/ar6/syr/.,66Sixth Assessment Report. https://www.ipcc.ch/report/sixth-assessment-report-working-group-ii/.]. It is noteworthy that the U. S. Government report on climate utilizes the results of the IPCC report [11S. Government. The Fifth National Climate Assessment. https://nca2023.globalchange.gov/.]. These reports hypothesize five potential scenarios of greenhouse gas emissions from 2015 to the end of the century (2100) and estimate the global average temperature gain from the mid-1800s for each scenario in the year 2100. The method of calculation in these reports is obscure. The results are merely stated.
The purpose of the present paper is to present a clear, simplified method for estimating the temperature gain in the year 2100. This includes yearly changes in atmospheric CO2 concentration and gains in Global Average Temperature (GAT) from 2015 to 2100. In order to facilitate the calculations, a set of scenarios of future emissions was chosen that is analogous to the scenarios used by the IPCC but is more amenable to computation.
The basic assumption in this paper is that most of the gain in GAT from the mid-1800s to 2015 (1.15 C as reported by the IPCC) was due to rising CO2 concentration in the atmosphere. In doing this, i did not consider several additional factors that might contribute to climate change, such as changes in solar intensity, changes in land use, possible release of methane from melting permafrost, changes in ocean currents, and changes in the Earth’s geomagnetic field. While these factors affect the overall complex climate system to some degree, the IPCC ended up plotting temperature gain vs. cumulative CO2 emissions (as in Figure 2) implying that CO2 (and associated other greenhouse gases) are the major determinant of climate, and this constraint was adhered to in the spirit of finding a simpler result parallel to that of the IPCC. This is a rather narrow view of climate change, but it seems to work for the period from the 1800s to the present. Over hundreds of millions of years, the Earth varied from very hot to very cold [77Rapp D. Assessing Climate Change: Temperatures, Solar Radiation and Heat Balance. 3rd Springer Praxis Books; 2014.]. It is widely believed that rising or falling CO2 concentration was the main factor in those changes. Coming out of the last ice age, there were many perturbations to the Earth’s climate but the last several hundred years appeared to reach a steady plateau until human activity started emitting CO2 [88Rapp D. Ice Ages and Interglacials. 3rd Springer Praxis Books; 2019.]. In this work, it was assumed (as apparently, the IPCC did) that the same amount of warming per gigaton CO2 from the past persists into the 21st century, and future warming in the 21st century can be estimated for any assumed future scenario of CO2 emissions. Estimates are available for the global amount of CO2 emitted from the 1800s to 2015. A relationship can then be derived between warming and gigatons of CO2 emitted for the period of 1800s to 2015.
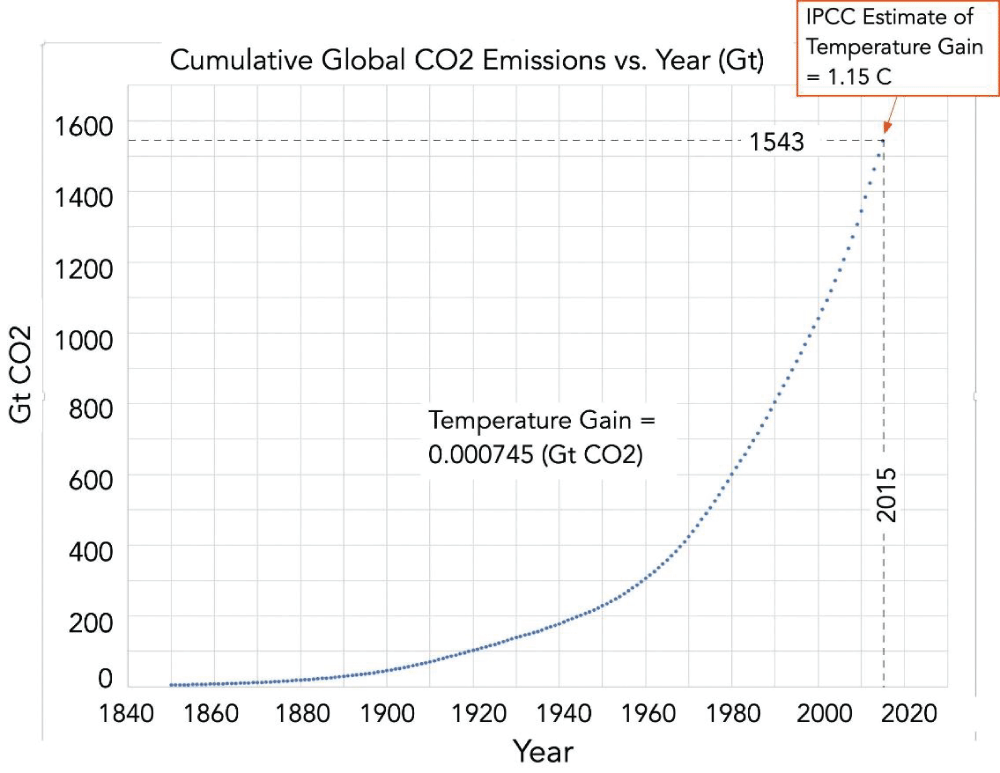
99Gilfillan D, Marland G. CDIAC-FF: global and national CO2 emissions from fossil fuel combustion and cement manufacture: 1751–2017. Earth System Science Data. 2021;13:1667–1680.]." /> Figure 2: Cumulative emissions of CO2 from the mid-1800s to 2015 (CDIAC) [99Gilfillan D, Marland G. CDIAC-FF: global and national CO2 emissions from fossil fuel combustion and cement manufacture: 1751–2017. Earth System Science Data. 2021;13:1667–1680.].
The principal greenhouse gases are CO2, CH4, CFC and N2O. CO2 is the major greenhouse gas with the greatest effect on warming (about 80% of the total warming effect).
In analyzing the effect of greenhouse gases on climate change, it is convenient to focus on CO2 because it is most easily measurable in the atmosphere. When discussing any increase in temperature due to an increase in CO2, what is meant is “due to CO2 plus another contribution from other greenhouse gases” but it is only said “due to CO2”.
If it is empirically observed that a certain amount of CO2 produces an amount of warming, what it means is “this much CO2 plus the other greenhouse gases that accompany CO2 produce that much warming”.
All further discussion of warming will be in terms of only CO2 with the understanding that CO2 plus other gases produce the warming.
Relation between Gt CO2 and temperature gain as provided by the IPCC
The 2023 IPCC study projected forward CO2 emissions and future temperature rise from 2015 to 2100 [55AR6 Synthesis Report: Climate Change 2023. https://www.ipcc.ch/report/ar6/syr/.,66Sixth Assessment Report. https://www.ipcc.ch/report/sixth-assessment-report-working-group-ii/.]. Their estimates of future gain in GAT were divided by cumulative Gt of CO2 emitted, to obtain a second estimate of gain in GAT per Gt CO2.
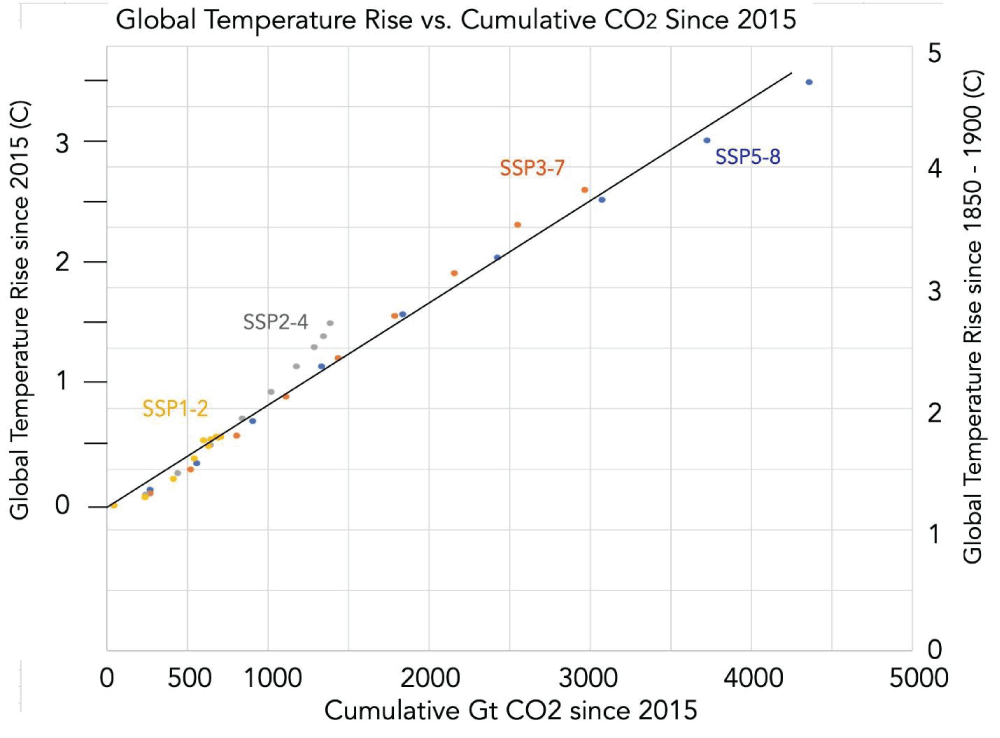
The IPCC data for four scenarios was used to compare the increase in GAT with the cumulative Gt of CO2 emitted as shown in Figure 1. It is somewhat arbitrary how to fit a line to this data. The slope of the linear fit that was chosen yields
∆T = 3.35/4000 = 0.000838 degrees per Gt
The IPCC result indicates a linear relation between cumulative emissions of CO2 and temperature rise since 2015.
Figure 1: Comparison of IPCC estimated gain in global average temperature to cumulative Gt CO2 emitted in IPCC scenarios.
In the present study, 2015 was adopted as the base year for predictions of climate in the 21st century, following the same choice made by the IPCC. Firstly, an estimate of cumulative emissions of CO2 prior to 2015 in Section 2.2 using the best estimates of this quantity made by experts in the field was carried out. The IPCC estimated that the gain in GAT from the mid-1800s to 2015 was 1.15 degrees Celsius. Further, the cumulative emissions of CO2 prior to 2015 were associated with the rise in GAT prior to 2015 to obtain the effective increase in GAT per cumulative Gt of CO2 for the pre-2015 period. This same relationship between CO2 emissions and the rise in GAT held in the period from 2015 to 2100 was assumed. Six hypothetical scenarios were created for future CO2 emissions in the period 2015 to 2100 and evaluated the change in GAT vs. year for all scenarios. Finally, the concentration of CO2 in the atmosphere was estimated assuming 50% of emissions end in the atmosphere.
CO2 emissions prior to 2015
The amount of CO2 emitted from the 1800s to 2015 was estimated by several groups. The Carbon Dioxide Information and Analysis Center (CDIAC) provides an estimate of total emissions of CO2 from the mid-1800s to 2015: 1,543 Gt [99Gilfillan D, Marland G. CDIAC-FF: global and national CO2 emissions from fossil fuel combustion and cement manufacture: 1751–2017. Earth System Science Data. 2021;13:1667–1680.-1111Understanding the basics of carbon dioxide. 2024. https://research.noaa.gov/2024/06/28/understanding-the-basics-of-carbon-dioxide/.]. Figure 2 shows an estimate (by CDIAC) of the cumulative emissions of CO2 from the mid-1800s to 2015 [99Gilfillan D, Marland G. CDIAC-FF: global and national CO2 emissions from fossil fuel combustion and cement manufacture: 1751–2017. Earth System Science Data. 2021;13:1667–1680.]. The estimate was 1543 Gt. It is noteworthy that the IPCC estimates that the gain in GAT from the mid-1800s to 2015 was 1.15 C [55AR6 Synthesis Report: Climate Change 2023. https://www.ipcc.ch/report/ar6/syr/.].
Therefore, it may be assumed that the gain in GAT per Gt CO2 was:
∆T = 1.15/1543 = 0.000745 degrees per Gt
This is slightly smaller than that previously estimated by the IPCC for the post-2015 period:
∆T = 0.000838 degrees per Gt
Since the result from prior to 2015 is based on data, while that after 2015 is based on models, the lower estimate seems likely to be more trustworthy and will be used in this report.
Modeling the 21st Century
It is convenient to define a set of scenarios for CO2 emissions in the 21st century that fit a simple mathematical formula, which then allows further calculation of other results via algorithms. These scenarios are quite like those used by the IPCC, except that simple mathematical formulas fit the scenarios chosen here.
The following formula was chosen for yearly Gt of CO2 emissions in the 21st century, where: “T” = year starting at 0 for 2015 and A, B, and C are parameters that could be varied to create different forms for scenarios.
Gt/y = 40*(1–A*EXP((–B)*EXP(–C*T)))
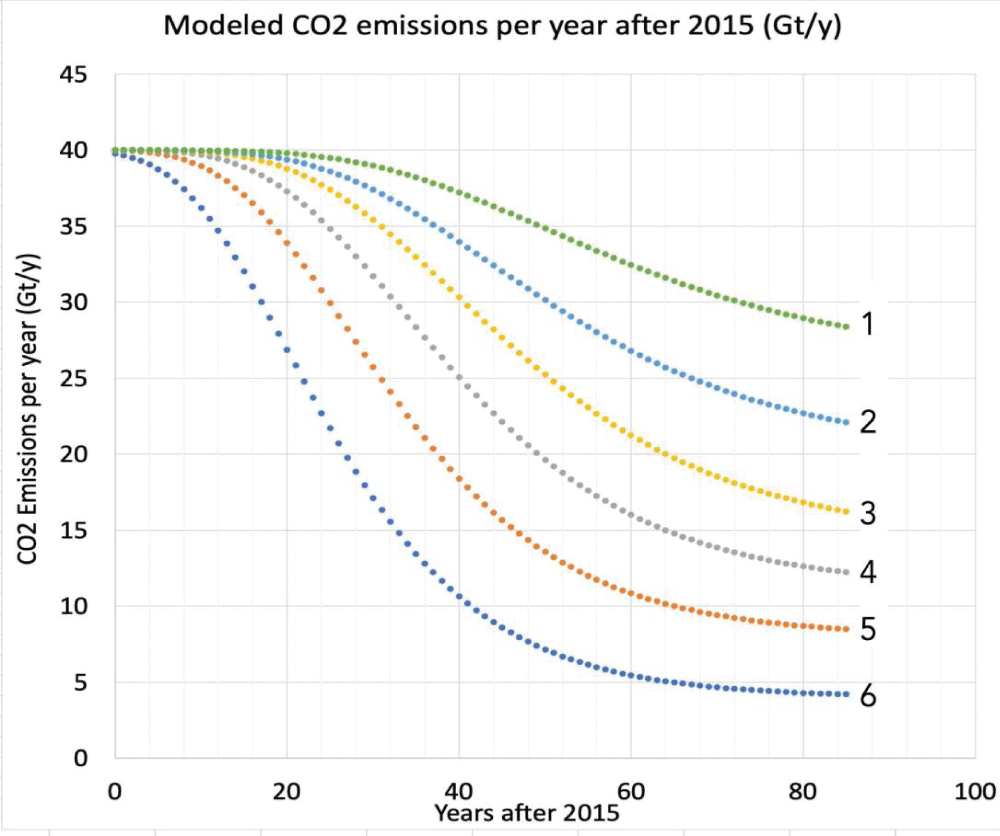
Values of the parameters were chosen for each scenario. Six scenarios were derived as shown in Figure 3.
Figure 3: Modeled CO2 emissions for the period 2015 to 2100 according to six scenarios.
Relation between emissions and global average temperature
In the spirit of the IPCC approach to climate, the following set of postulates were adopted:
The Global Average Temperature (GAT) was estimated since the late 1800s – as measured by networks of stations around the world.
The GAT would have remained roughly constant over the past 200 years, had it not been for emission of greenhouse gases.
All the observed temperature gain since the late 1800s was due to increased concentrations of greenhouse gases in the air.
The temperature gain from the late 1800s to 2015 was 1.15 C.
2015 is selected as a reference starting point for predicting future increases in GAT in the 21st century.
Future increases in GAT will be driven by additional emissions of greenhouse gases beyond 2015.
Although the world responds to all greenhouse gases, CO2 accounts for about 80% of the temperature rise, and temperature rise can be correlated with CO2, allowing that the total temperature rise is due to CO2 plus the other greenhouse gases in proportion.
If these implied postulates of the IPCC are adopted, the cumulative CO2 emissions can be compared to the temperature increase for any period, and thereby estimate how much temperature rise per Gt of CO2 can be expected in the future.
For the period from the mid-1800s to 2015, it was found that approximately 1,543 Gt of CO2 was emitted and the gain in GAT was estimated at 1.15 C. Therefore, one might guess that the change in temperature per Gt CO2 is:
∆T = 1.15/1543 = 0.000745 degrees per Gt
Atmospheric concentration
Normally, one might proceed through a sequence of steps:
Utilize emissions for any scenario ⇒ estimate cumulative emissions ⇒ estimate fraction of emissions that remain in the atmosphere ⇒ estimate atmospheric concentration of CO2 in ppm ⇒ estimate increase in GAT from CO2 ppm and indeed, that is likely what the IPCC did. However, the IPCC did not make ppm data readily available, so it was necessary to proceed backwards. The atmospheric concentration was measured. This can be compared to cumulative emissions and the relation between emissions and atmospheric concentration determined. For this, two approaches were considered.
Approach #1
From the 1800s to 2015, 1543 Gt CO2 was emitted, and the increase in atmospheric CO2 ppm was from 285 to 400 (the increase was 115 ppm)
1543 Gt is equivalent to 115 ppm
1 Gt increases the atmospheric concentration by 0.075 ppm
It takes 13.4 Gt of CO2 to increase the concentration by 1 ppm
Approach #2
The Earth’s atmosphere has an estimated mass of 5.15 x 10⁶ Gt.
The molecular weight of the atmosphere is about MW ~ 28.96
The atmosphere includes about (5.15 x 10⁶)/28.96 = 1.78 x 10⁵ moles
1 Gt of CO2 is 1/44 = 0.0227 Moles
If 1 Gt CO2 remained in the atmosphere, the molar ratio of CO2 would be (0.0227)/(1.78 x 105)= 1.30 x 10-7 = 0.130 ppm
Thus, 1 Gt CO2 à 0.130 ppm – if it all remained in the atmosphere
If 50% of the emitted CO2 remains in the atmosphere, 1 Gt CO2 à 0.130 ppm x 0.50 = 0.065 ppm
Thus, it would take 15.4 Gt CO2 to raise the concentration by 1 ppm
Approach #1 is based on rough estimates of emissions prior to 2015. Approach 2 is exact, but it depends on the estimated percentage of CO2 that remains in the atmosphere. There are various estimates for the percentage of CO2 that remains in the atmosphere and it has been estimated to be about 50% [77Rapp D. Assessing Climate Change: Temperatures, Solar Radiation and Heat Balance. 3rd Springer Praxis Books; 2014.]. It is not clear which estimate is more reliable. Rather arbitrarily, the result of Approach #2 will be used in further calculations. These calculations are approximate and it is not possible to be exact.
Six scenarios were chosen for annual emissions of CO2 from 2015 to 2100 as shown previously in Figure 3. Each yearly emission scenario obeyed the following formula:
Gt/y = 40*(1–A*EXP((–B)*EXP(–C*T)))
Where “T” = year starting at 0 for 2015 and A, B, and C are parameters that could be varied to create the different scenarios.
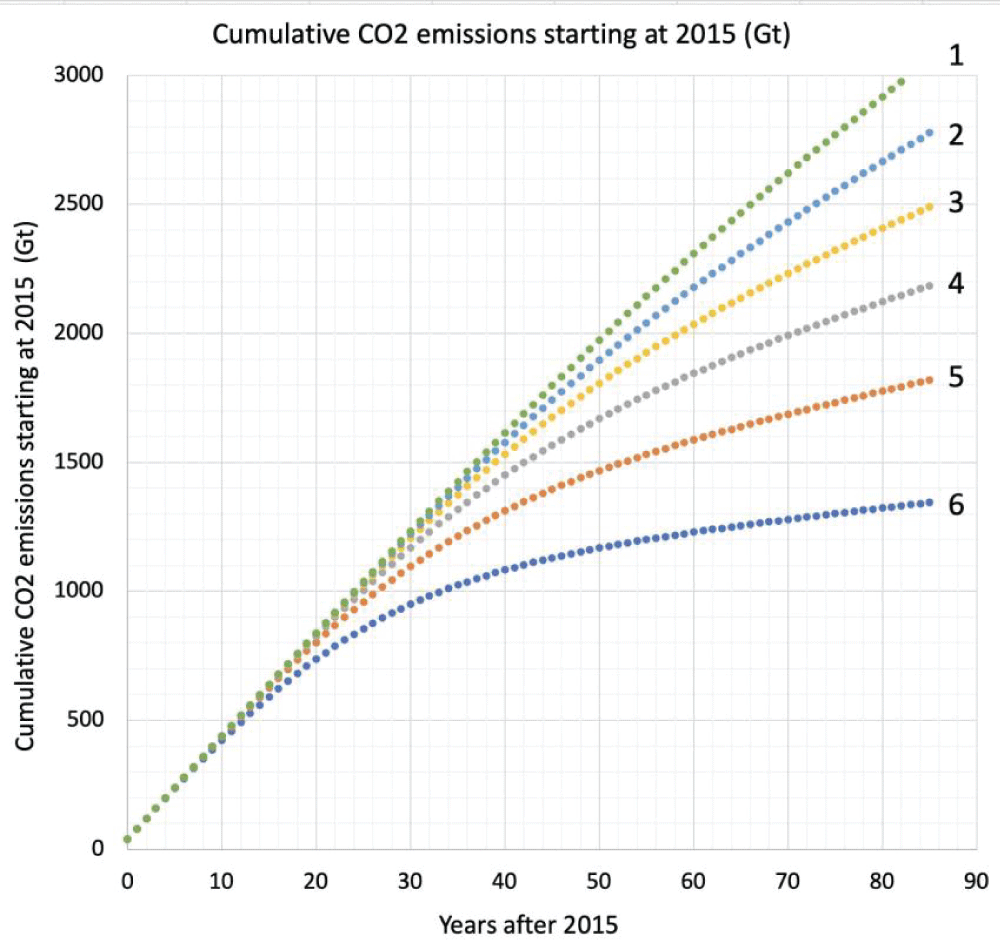
For each of the six scenarios, the emission from 2015 was summed to any year in the 21st century to plot the cumulative CO2 emissions in the 21st century for each scenario for each year as shown in Figure 4.
Figure 4: Cumulative CO2 emissions from 2015 to 2100 (Gt).
Atmospheric CO2 concentration in the 21st century
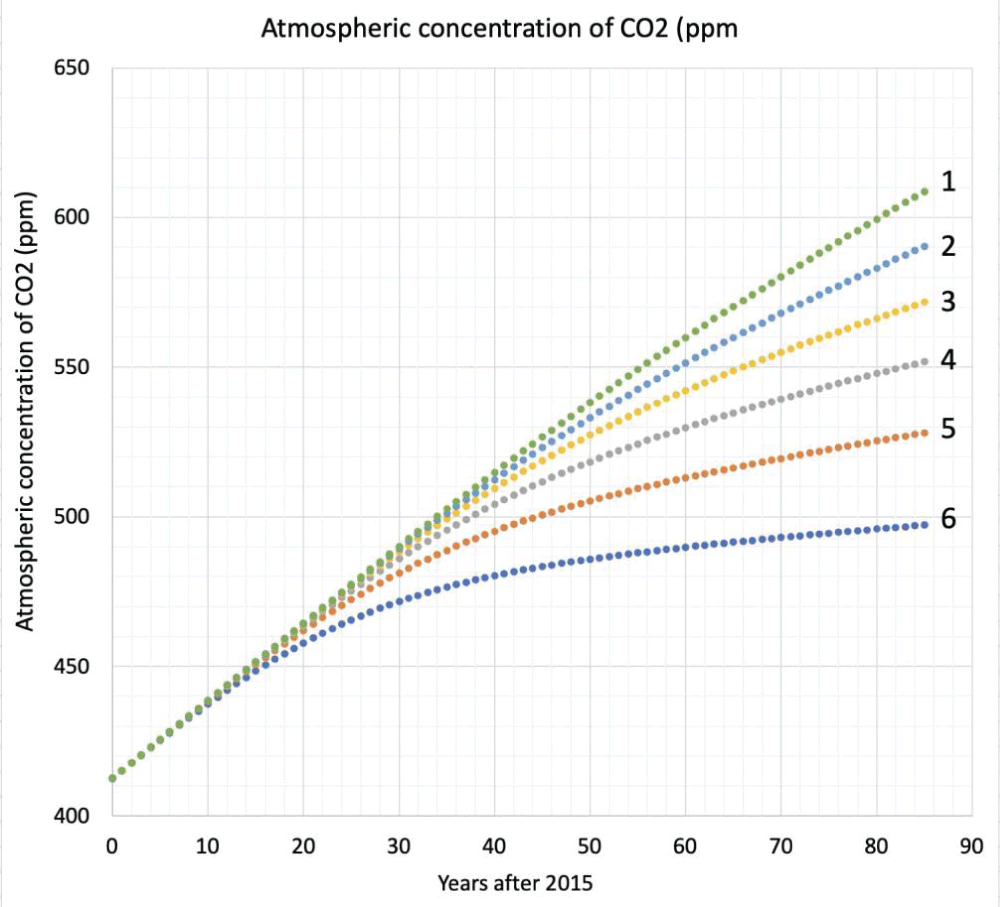
The CO2 concentration in the atmosphere was steady over the past few hundred years at around 280 ppm. It started rising in the late 1800s and reached about 410 ppm in 2015. As the emission of CO2 continues in the 21st century, the atmospheric concentration of CO2 will rise. In Section 2.5, it was estimated that each Gt of CO2 emissions increases the atmospheric concentration of CO2 by 0.065 ppm. For any cumulative emissions level in any year, the concentration of CO2 in the atmosphere was estimated by the formula: 1 Gt CO2 ⇒ 0.065 ppm. This is shown in Figure 5. Evidently, even in the most optimistic scenario, the concentration will reach 500 ppm in the year 2100.
Figure 5: Atmospheric CO2 ppm from 2015 to 2100 (Gt).
Temperature gain from the mid-1800s to the 21st century
It was previously shown that it took 1,543 Gt of CO2 emissions to raise the GAT by 1.15 C from the 1800s to 2015, and from that, it was concluded that the increase in GAT per Gt of CO2 could be approximated by:
∆T = 1.15/1543 = 0.000745 C per Gt
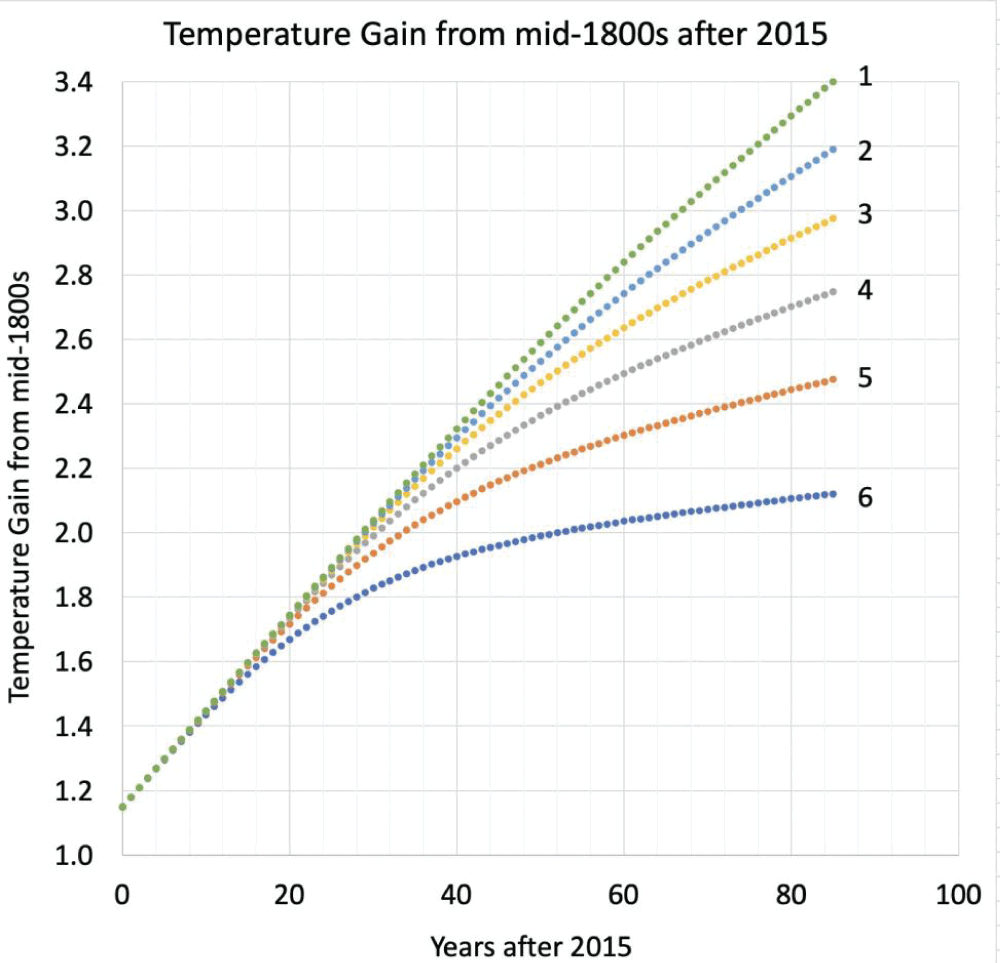
Our estimate of cumulative missions in the 21st century for each scenario is given in Figure 4. It is then a simple matter to convert cumulative Gt of CO2 to an increase in GAT by the above formula to derive the increase in GAT for each scenario as shown in Figure 6.
Figure 6: Temperature gain from the 1800s to any date after 2015.
It is important to emphasize that this study is not a comprehensive analysis of climate change in the 21st century, including the many global factors that might contribute to climate change. Climate change is a very complex subject. For example, Rapp (2019) discussed many aspects of climate change in 900 pages and has not reached a definitive conclusion without uncertainty [77Rapp D. Assessing Climate Change: Temperatures, Solar Radiation and Heat Balance. 3rd Springer Praxis Books; 2014.].
The IPCC carried out sophisticated analyses of future climate change in the 21st century but the details of their models are not readily accessible. One can only imagine the extent of their models and calculations. The IPCC Synthesis Report was written by a team of 30 authors from all over the world [55AR6 Synthesis Report: Climate Change 2023. https://www.ipcc.ch/report/ar6/syr/.]. The IPCC Report AR-6 was written by 330 authors from around the world [66Sixth Assessment Report. https://www.ipcc.ch/report/sixth-assessment-report-working-group-ii/.]. However, the results of the IPCC models were presented as graphs of increase in GAT vs. cumulative CO2 emissions, which were interpreted here as Figure 1. The IPCC models were based on rising CO2 concentration as the major determinant of future climate change in the 21st century, and other factors were considered secondary. Since the result of the IPCC models was ∆T vs. emissions of CO2, the author decided to investigate whether it was possible to bypass the work of hundreds of climate scientists and related experts at the IPCC, and simply examine the known relationships between CO2 emissions and temperature rise, neglecting all the other myriad factors that might affect climate change, and thereby derive predictions of temperature rise in the 21st century based only on CO2.
A model was constructed based on the postulate that the warming per Gt of CO2 emitted that was experienced from the mid-1800s to 2015 was due to increased greenhouse gases and that further emission of greenhouse gases in the 21st century will produce further warming in the same proportion to the emissions. Six scenarios for the 21st century were presented, providing a graded variation from low emissions to high emissions. For each scenario, the yearly CO2 emitted was generated from an algebraic formula, making it easy to calculate the cumulative emissions through the 21st century by simple addition. The yearly temperature gain and the atmospheric concentration of CO2 were estimated for each year from 2015 to 2100.
The result of these calculations is very similar to the results of the IPCC. It was found that:
The range of CO2 concentrations in the year 2100 ranges from about 500 ppm to about 610 ppm from the optimum to the worst scenarios of future emissions. It seems unlikely that despite the world’s best efforts, the CO2 concentration can be held below 500 ppm.
The temperature gain from the 1800s to the year 2100 would range from 2.1 C to 3.4 C from the optimum to the worst scenarios of future emissions. It seems unlikely that despite the world’s best efforts, the rise in GAT from the 1800s to 2100 can be held below 2.1 ppm.
These results derive from a model that assumes:
Carbon dioxide is the sole determinant of climate change
The relation between CO2 emissions and GAT from the 1800s to 2015 will also hold beyond 2015
The percentage of emissions that remain in the atmosphere is about 50%
The best way to consider this result is that if indeed CO2 is the dominant determinant of future climate change, this result provides a reasonable and simply understood estimate of aspects of climate change in the 21st century for several future emission scenarios.
S. Government. The Fifth National Climate Assessment. https://nca2023.globalchange.gov/.
Climate change predictions: Anticipating and adapting to a warmer world. https://www.ibm.com/blog/climate-change-future/.
Hamdan A, Alsalaymeh A, AlHamad IM, Ikemba S, Ejike Ewim DR. Producing future global temperature and greenhouse gas emissions via LSTM model. Sustainable Energy Research. 2023;10:21.
Stanford University. Earth likely to cross critical climate thresholds even if emissions decline, Stanford study finds. 2023. https://news.stanford.edu/stories/2023/01/ai-predicts-global-warming-will-exceed-1-5-degrees-2030s/.
Rapp D. Assessing Climate Change: Temperatures, Solar Radiation and Heat Balance. 3rd Springer Praxis Books; 2014.
Rapp D. Ice Ages and Interglacials. 3rd Springer Praxis Books; 2019.
Gilfillan D, Marland G. CDIAC-FF: global and national CO2 emissions from fossil fuel combustion and cement manufacture: 1751–2017. Earth System Science Data. 2021;13:1667–1680.
Vigna L, Friedrich J, Damassa T. The History of Carbon Dioxide Emissions. World Resources Institute; 2024. https://www.wri.org/insights/history-carbon-dioxide-emissions?utm_campaign=socialmedia&utm_source=facebook&utm_medium=worldresources.
Understanding the basics of carbon dioxide. 2024. https://research.noaa.gov/2024/06/28/understanding-the-basics-of-carbon-dioxide/.
Rapp D. Estimate of Temperature Rise in the 21st Century for Various Scenarios. IgMin Res. Jul 11, 2024; 2(7): 564-569. IgMin ID: igmin218; DOI:10.61927/igmin218; Available at: igmin.link/p218
Address Correspondence: Donald Rapp, 1445 Indiana Ave., South Pasadena, CA 91030, USA, Email: [email protected]
How to cite this article: Rapp D. Estimate of Temperature Rise in the 21st Century for Various Scenarios. IgMin Res. Jul 11, 2024; 2(7): 564-569. IgMin ID: igmin218; DOI:10.61927/igmin218; Available at: igmin.link/p218
Figure 1: Comparison of IPCC estimated gain in global averag...
Figure 2: Cumulative emissions of CO2 from the mid-1800s to ...
Figure 3: Modeled CO2 emissions for the period 2015 to 2100 ...
Figure 4: Cumulative CO2 emissions from 2015 to 2100 (Gt)....
Figure 5: Atmospheric CO2 ppm from 2015 to 2100 (Gt)....
Figure 6: Temperature gain from the 1800s to any date after ...
S. Government. The Fifth National Climate Assessment. https://nca2023.globalchange.gov/.
Climate change predictions: Anticipating and adapting to a warmer world. https://www.ibm.com/blog/climate-change-future/.
Hamdan A, Alsalaymeh A, AlHamad IM, Ikemba S, Ejike Ewim DR. Producing future global temperature and greenhouse gas emissions via LSTM model. Sustainable Energy Research. 2023;10:21.
Stanford University. Earth likely to cross critical climate thresholds even if emissions decline, Stanford study finds. 2023. https://news.stanford.edu/stories/2023/01/ai-predicts-global-warming-will-exceed-1-5-degrees-2030s/.
Rapp D. Assessing Climate Change: Temperatures, Solar Radiation and Heat Balance. 3rd Springer Praxis Books; 2014.
Rapp D. Ice Ages and Interglacials. 3rd Springer Praxis Books; 2019.
Gilfillan D, Marland G. CDIAC-FF: global and national CO2 emissions from fossil fuel combustion and cement manufacture: 1751–2017. Earth System Science Data. 2021;13:1667–1680.
Vigna L, Friedrich J, Damassa T. The History of Carbon Dioxide Emissions. World Resources Institute; 2024. https://www.wri.org/insights/history-carbon-dioxide-emissions?utm_campaign=socialmedia&utm_source=facebook&utm_medium=worldresources.
Understanding the basics of carbon dioxide. 2024. https://research.noaa.gov/2024/06/28/understanding-the-basics-of-carbon-dioxide/.


 スキャンしてリンクを取得


![Cumulative emissions of CO2 from the mid-1800s to 2015 (CDIAC) [9].](https://www.igminresearch.jp/articles/figures/igmin218/igmin218.g002.png)