Welcome to IgMin Research – an Open Access journal uniting Biology, Medicine, and Engineering. We’re dedicated to advancing global knowledge and fostering collaboration across scientific fields.
Welcome to IgMin, a leading platform dedicated to enhancing knowledge dissemination and professional growth across multiple fields of science, technology, and the humanities. We believe in the power of open access, collaboration, and innovation. Our goal is to provide individuals and organizations with the tools they need to succeed in the global knowledge economy.
IgMin Publications Inc., Suite 102, West Hartford, CT - 06110, USA
Using the superposition model, the crystal field and zero-field splitting parameters of Cr3+ doped cassiterite (tin oxide), SnO2 single crystals are computed. For calculations, the appropriate locations for Cr3+ ions in SnO2 with distortion are taken into account. The experimental values and the zero-field splitting parameters in theory with local distortion agree fairly well. Using the Crystal Field Analysis Program and crystal field parameters, the optical energy bands for Cr3+ in SnO2 are calculated. The findings indicate that in SnO2 single crystals, one of the Sn4+ ions is replaced by Cr3+ ions.
When examining the local symmetry of transition ions in crystals, electron paramagnetic resonance, or EPR, is thought to be a crucial tool. The Cr3+ ion introduced into different crystals provides good information about the Crystal Field (CF) and zero field splitting (ZFS) parameters [1-4]. When divalent or trivalent impurities are used in place of monovalent ions, it is crucial to compensate for the charge imbalance. In such systems positive ion vacancies fulfill the charge compensation [5]. The optical characteristics of the crystal are impacted by substituted impurities that cause very little structural change. The Superposition Model (SPM) is mostly used for the theoretical estimation of ZFS and CF parameters [6-8]. It is worth mentioning various semiempirical approaches developed for modeling CF parameters (CFPs) based on crystal structure data. Apart from the historically first, Point Charge Model (PCM), other CFP modeling approaches are Superposition Model (SPM), Angular Overlap Model (AOM), and Simple Overlap Model (SOM). These approaches may yield varying results even using the same crystallographic data as input. Various modeling techniques for the analysis and interpretation of EMR data for transition ions at low symmetry sites in crystals have been reviewed [8]. The superposition model was originally developed and applied first to CFPs for lanthanide ions in various crystals and later to CFPs for transition metal ions. Subsequently, its applications have been extended to the semi-empirical parameterization of Zero-Field Splitting Parameters (ZFSPs) and interpretation of EPR spectra for the S-state 3d5 and 4f7 transition ions. It should be emphasized that out of the semi-empirical approaches applicable for CFPs: PCM, SPM, AOM, and SOM, only SPM is also applicable to ZFSPs. In fact, SPM may be employed independently for modeling both CFPs and ZFSPs, whereas attempts to use PCM for ZFSPs occasionally appear in EMR literature. SPM calculations of CFPs and those of ZFSPs utilize the same mathematical framework [8]. Accurate interpretation of EMR experimental spectra and modeling of ZFSPs is important for proper understanding of spectroscopic and magnetic properties of crystals containing 4fN and 3dN ions. SPM yields calculable predictions for EMR experiments in which transition ions are used as probes to investigate the structure and nature of paramagnetic centers. Modeling using SPM may also help predict characteristics important for potential applications. Hence, SPM calculations of ZFS parameters are of prime importance.
SnO2 is one of the important semiconducting oxides having desirable qualities such as optical transmittance, mechanical hardness, low resistivity, stability under heat treatment, uniformity, and piezoelectric behavior. This semiconductor, which is of the n-type and has a wide band gap of 3.6 eV at 300 K, is highly iconic and has a wide range of uses. Some of these uses include gas sensors, catalyst supports, dye-sensitized solar cells, supercapacitors, and transparent conducting electrodes [9-13]. Recently, some researchers have added metal or halogen ions to SnO2 as impurities, changing its surface states, electronic structure, and optical characteristics in the process, which has improved the material’s qualities and potential applications [10,14,15]. Moreover, the Cr3+-doped SnO2 materials are useful in solid-state lighting [16].
EPR study for Cr3+ ions in SnO2 was performed and spin Hamiltonian parameters were evaluated [17]. Sn4+ ions have an ionic radius of 0.069 nm, which is marginally greater than Cr3+ ions’ ionic radius of 0.0615 nm. Hence Cr3+ substitutes for one of the Sn4+ ions as discussed in [17].
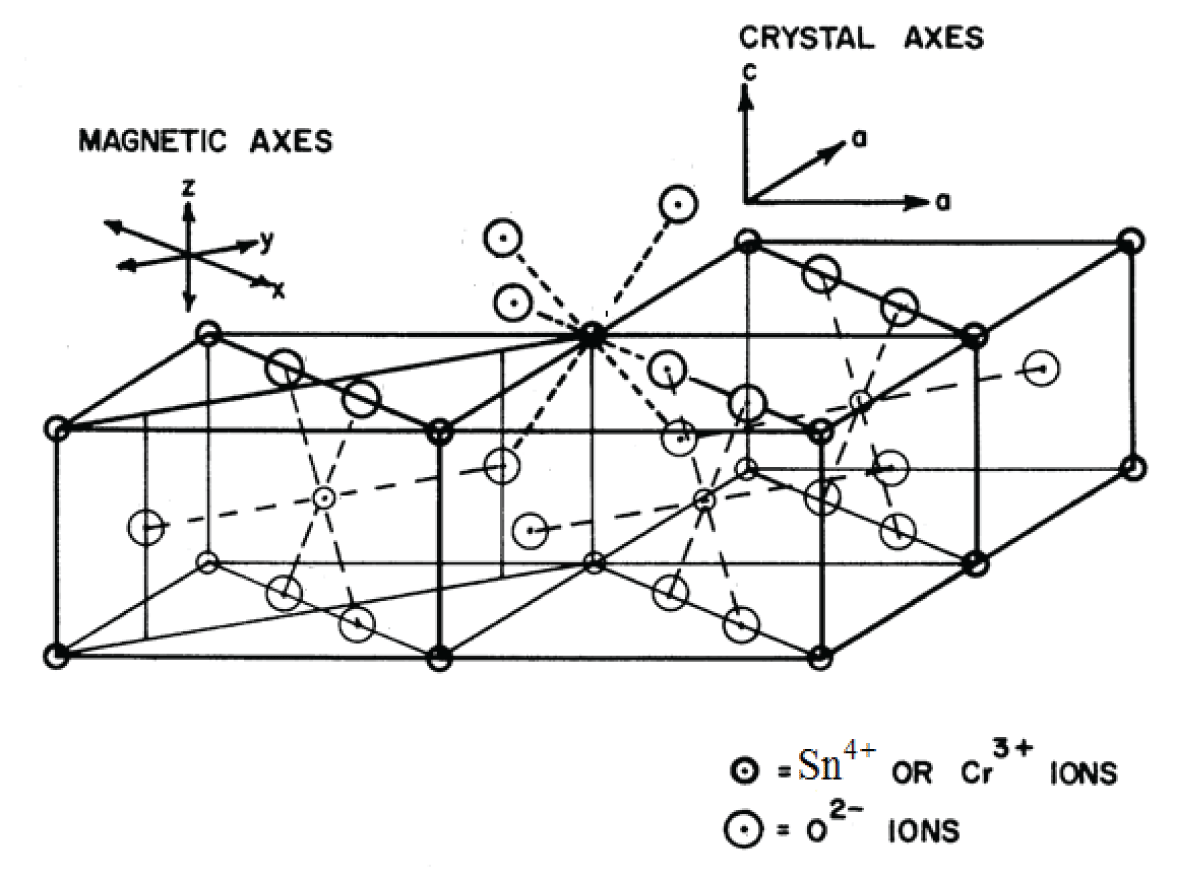
The crystallographic axes (a, b, and c) and the laboratory axes (x, y, and z) are chosen in parallel. The symmetry-adopted axes (magnetic axes) have labels (X, Y, Z). The crystallographic c axis is found to correspond with the principal Z axis of the g and D tensors of Cr3+ ions.
The superposition model (SPM) analysis of the ZFS and CF parameters for Cr3+ ions in SnO2 single crystal is presented in the current work. Investigating the ZFS parameters, the CF parameters, and the lattice distortion for the Cr3+ ions in SnO2 at octahedral sites is the goal. The Crystal Field Analysis (CFA) computer program and CF parameters are used to determine the optical energy bands for Cr3+ ions in SnO2. The estimated CF and ZFS parameters could both be helpful in later research for obtaining crystals of various scientific and industrial applications.
Crystal structure
SnO2 belongs to the TiO2 (Rutile) crystal class, which crystallizes in a space group P42 21/n 2/m-D4h14 tetragonal crystal system [18]. The unit cell has the following parameters: a = 0.4737 nm, b = 0.4737 nm, and c = 0.3185 nm. Two nonequivalent Sn4+ sites make up the unit cell, and they can be converted into one another by rotating 900 around the c-axis. Due to a slight deformation of the SnO6 octahedra, an orthorhombic local symmetry D2h is formed around the Sn4+ site. Figure 1 shows the SnO2 crystal structure with the Symmetry-Adopted Axis System (SAAS).
Figure 1: The crystal structure of SnO2 together with the symmetry-adopted axis system (SAAS).
The directions of metal-ligand bonds that are mutually perpendicular are the symmetry adopted axes (SAA) or local site symmetry axes. For centers I, the two other axes (X, Y) are perpendicular to the Z axis of SAAS, which is along the metal-ligand bond Sn-O (crystal c-axis) (Figure 1). This suggests that in the SnO2 crystal, Cr3+ takes the place of Sn4+ with approximately orthorhombic symmetry. The ionic radius of Cr3+ ions (0.0615 nm) is slightly less than that of Sn4+ ions (0.069 nm), suggesting that Cr3+ ions can, with some distortion, occupy the position of Sn4+ ions. The ligands’ spherical polar coordinates and the position of the Cr3+ ion for center I in SnO2 are shown in Table 1 [18]. These specifics are employed for Cr3+ ion CF and ZFS computations in SnO2.
Table 1: The Cr3+ ion's fractional coordinates and the spherical polar co-ordinates (R, θ, ф) of ligands (center I) in a single crystal of SnO2.
Position of Cr3+
Ligands
Spherical polar co-ordinates of ligands
RÅ
Θ0
Ф0
ND: Substitutional
(0.0000, 0.0000, 0.0000)
O1
2.2772
64.57
45.00
O2
2.0566
89.91
45.00
O3
4.2409
67.94
13.44
O4
4.2409
67.94
76.55
O5
2.0566
89. 91
-45.00
O6
2.0566
89.91
-45.00
WD: substitutional Centre I
(-0.1662, -0.1185, -0.0022)
O1
3.1712
71.91
41.95
O2
1.1145
89.47
53.24
O3
5.0978
71.71
17.74
O4
4.9672
71.21
68..78
O5
2.4128
89.92
-21.71
O6
2.1230
89.91
-71.69
Computations of splitting parameters for zero field
The energy levels of Cr3+ ions in crystals are found using the spin Hamiltonian [19-21]:
ℋ = ℋZe+ ℋZFS
(1)
Where spectroscopic splitting factor, Bohr magneton, and steady magnetic field are represented by g, µB, and B, respectively. S represents the effective spin operator and
are the extended Stevens operators (ESO) [22,23]; and are the parameters of ZFS, ƒk = 1/3 and 1/60 give the scaling factors for k = 2 and 4, respectively. At orthorhombic symmetry sites, the ZFS terms in (1) for the Cr3+ ion (S = 3/2) are evaluated as [24,25]:
HZFS
, (2)
The traditional orthorhombic ZFS parameters D, E and
, have relations :
(3)
In ESO notation, the parameters of ZFS for any symmetry utilizing SPM [24,25] are obtained as:
(4)
Where (Ri, θI, ϕi) present the spherical polar coordinates of the i-th ligand. The intrinsic parameters
represent the magnitude of a ligand’s k-th rank ZFS contribution at a distance Ri and the coordination factors
provide the geometrical data.
for k=1 to 6 in ESO notation [26] are given in Appendix A1 of [27].
Eq. (4), in terms of the intrinsic parameters
, the power-law exponents tk and the reference distance R0, provide traditional ZFS parameters, D and E as given below[27,28-30]:
(5)
The Sn4+ ion site and the interstitial site with a comparable ligand environment are expected to be substituted by the Cr3+ ion in SnO2. The Cr3+ ion’s local symmetry is orthorhombic. In LiNbO3 having octahedral coordination of Cr3+ ion with Cr3+-O2- bond, t2 = -0.12 and =
2.34 cm-1 [31] were taken to compute
and
. Since oxygen serves as a ligand and the Cr3+ ion in SnO2 has distorted octahedral coordination (Figure 1),
the in the current study is established using
= 2.34 cm-1 and t2 = -4.173 for the center I.
The spherical polar coordinates of ligands and the Cr3+ ion’s location as shown in Table 1 are considered for computation. The traditional ZFS parameters, D and E of Cr3+ ion in a single crystal of SnO2 are calculated using Eq. (5). The reference distance R0 = 0.200 nm is used [32] to find the ZFS parameters, and the values are: |D| = 2395.2 × 10-4 cm-1and |E| = 4.2E-13 × 10-4 cm-1 for center I. For symmetry that is orthorhombic, the ratio
should fall between 0 and 1 [33]. In the current calculation, the ratio
= 5.2E-16 and |E| / |D| = 1.74E-16 for the center I. It is seen that the calculated values of |D| and |E| do not match with the experimental ones though
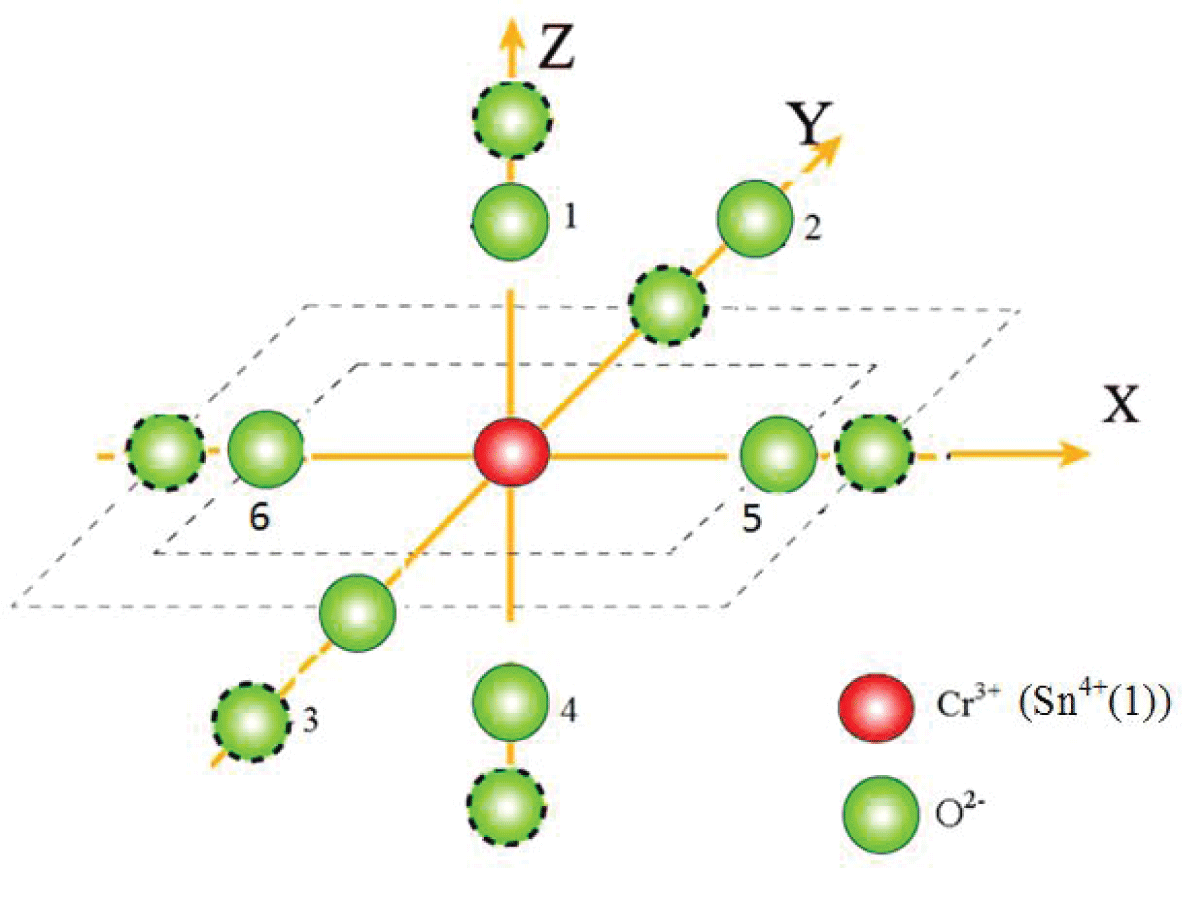
falls in the specified range [33]. Therefore, with the above t2 and reference distance R0, the ZFS parameters |D| and |E| are calculated for Cr3+ at the Sn4+ site with distortion having position Sn4+ (-0.1662, -0.1185, -0.0022) for center I. The local environment about Cr3+ is shown in Figure 2. The traditional ZFS parameters obtained now are |D| = 5778.1 × 10-4 cm-1, |E| = 953.6 × 10⁻⁴ cm-1for center I, which are matching fairly well with the values found from the experiment. The ratio
= 0.495 and |E| / |D| = 0.165 for the center I are in the specified range [34]. Further, with the above t2 and reference distance R0, the ZFS parameters |D| and |E| are calculated for Cr3+ at the interstitial site but the values discovered differ significantly from the experimental ones. For this reason, they are not included here.
Figure 1: Visual depiction of the local environment (dotted circles show positions after distortion).
Table 2 gives the experimental and calculated ZFS parameters of the Cr3+ ion in SnO2. It shows that the ZFS parameters |D| and |E| are in fair agreement with the values of the experiment [17] when the distortion is introduced into the calculation.
Table 2: The reference distance and calculated and Cr3+'s experimental ZFS parameters in a single crystal of SnO2 for the center I.
WD = With distortion, ND = No distortion, e = experimental.
Computations of the crystal field’s parameters
The transition ion CF energy states in crystals [34-37] can be obtained using Wybourne operators as follows [19,38,39]:
(6)
Where HCF is CF Hamiltonian. The metal-ligand complex’s CF parameters in equation (6) are found using SPM [24,25] as follows:
(7)
R0 denotes the reference distance, Ri, θi, φi provide the ith ligand spherical polar coordinates and Kkq are the coordination factors [34]. = 40, 400 cm-1, t2 = 1.3, =11, 700 cm-1 and t4 = 3.4 are used to find Bkg (k = 2, 4; q = 0, 2, 4) [34]. Table 3 contains a list of the calculated Bkq parameters. The ratio |B22|/|B20| = 0.091 for the center I, which suggests that Bkq parameters established are standardized [33]. In order to analyze the optical spectroscopy data using the crystal-field approach, an efficient computer program for diagonalization of a complete Hamiltonian (including electrostatic terms, Trees correction, spin-orbit interaction, and crystal-field) within the 3dN configuration (N = 2 to 8) is essential. Yeung and Rudowicz [35,36] recently developed a computer program CFA for 3dN configuration (N = 2 to 8) and for symmetry as low as orthorhombic. The CF analysis computer program is suitable for orthorhombic symmetry, tetragonal symmetry, cubic symmetry, trigonal symmetry, and hexagonal symmetry. Monoclinic and triclinic as well as trigonal and tetragonal symmetry cases involving “imaginary” CF terms are also included. Note that in the latter cases, the complex CF parameter can be made real by an appropriate rotation around the z-axis. Other low-spin states, e.g. S = 1, 0, for 3d4 and 3d6 ions and S = 3/2, l/2 for 3d5 ions, arising at strong ligand fields, as well as the low spin to high spin transition can also be studied using the package. The Hamiltonian for a 3dN ion in crystals can be written as the sum of the free-ion Hamiltonian, the spin-orbit interaction, and the Trees correction describing the two body orbit-orbit polarization. The crystal (ligand) field Hamiltonian in the equation in Wybourne’s notation is taken in terms of the crystal field parameters Bkq and the renormalized spherical tensor operators. Since the ligand field is in the weak to intermediate range for most of the 3d transition metal ions in crystals, the basis of states in the LS coupling scheme can be taken. The Slater integrals Fk (k = 0, 2, and 4) are related to the Racah parameters A, B, and C as follows:
Table 3: Bkq parameters of Cr3+ for center I with distortion in a single crystal of SnO2.
Calculated Bkq (cm-1) Parameters used for the CFA program
Site
R0Å
B20
B22
B40
B42
B44
| B22 | / | B20 |
Center I WD
2
-86000.9
-7869.12
46442.65
10243.45
-94402.8
0.091
WD = With distortion.
A = F0 - 49FF4
B = F2 - 5FF4
C = 35F4
And F0 = F0, F2 = F2/49, F4 = F4/441. Usually, we set A = 0 since it will cause no energy
Level splittings apart from shifting the center of the whole spectrum. Racah parameters A, B, C, Tree’s correction and spin-orbit coupling, and the CF parameters Bkq are taken as input parameters.
The total Hamiltonian is diagonalized to calculate the CF energy levels of the Cr3+ ion in SnO2 single crystals using the Bkq parameters in Table 3 and the CFA computer program [35,36]. Table 4 shows the energy values that were calculated. The calculated and experimental energy values for Cr3+: Cassiterite (SnO2) [40] are contrasted. The experimental and theoretical energy values seem to be reasonably in agreement based on Table 4. Therefore, the experimental findings are supported by examining Cr3+ ions at Sn4+ sites in SnO2 theoretically [17,40].
Table 4: Energy values of Cr3+ in SnO2 single crystal determined by computation and experimentation (center I).
Transition from
Observed
Calculated band using CFA (cm-1)
4A2g(F)
band (cm-1)
Center I
2Eg(G)
14518
12396, 12533
2T1g(G)
12669, 13605, 14076
4T2g(F)
18389
14735, 14800, 15282,15414, 15897, 20316
4T1g(F)
23228
24334, 26120, 27018,27597, 27897, 28835
4T1g(P)
29673, 30762, 30961,31575, 42777, 46856
2T1g(aD)
49768, 52745, 79331
2Eg(bD)
79342, 83419
(The spin-orbit coupling constant, the Racah parameters A, B, and C, and the Trees correction have respective values of 276, 0, 442, 3676, and 70 cm-1).
SPM studies of 3dN ions in ferroelectrics, for example, Fe3+ ions in PbZrO3, Pb(ZrxTi1-x)O3 and PbTiO3 and Cr3+ ions in PbTiO3 and BaxPb1-xTiO3 powders, Mn2+ ions in BaTiO3 nanopowders, and other related ion-host systems as well as Fe3+ and Mn2+ in ZnO also back the experimental EPR findings [8]. The major usage of this investigation may be done in studies of Single Molecule Magnets (SMM), Single-Chain Magnets (SCM), and Single Ion Magnets (SIM) based on transition ions for computational modeling of their properties. The SMM, SCM, and SIM are formed by polynuclear clusters assembled from mononuclear coordination complexes. These systems have become a subject of large interest due to their unique magnetic properties like the phenomenon of macroscopic quantum tunneling of magnetization, as well as possible applications in high-density information storage and quantum computing [8]. Recently many novel SMM or SCM systems containing Cr3+ and/or Mn2+ ions as well as nanomagnets with elaborate coordination geometry containing Gd3+ ions have been synthesized [8].
The spectra of optical absorption of Cr3+-activated phosphors are now explained using Franck-Condon analysis using the model known as configurational-coordinate (CC) [41]. The various excited state-ground state transitions in Cr3+ are a result of the lattice vibrations’ strong coupling (CC model) [41]. The CC model is not being utilized so there is a difference between excited-state peak energies obtained here and energies of the zero-phonon line (ZPL) discussed in [41,42]. There are two types of oxide-phosphors that are doped with Cr3+: the O-Cr-A type and the O-Cr-B type. The characteristics of type O-Cr-A phosphors’ luminescence are obtained from the 2Eg-related luminescence transitions as their crystal-field strength lies in the region of Dq/B > 2.1 while type O–Cr–B phosphors have a crystal-field strength falling within the range of Dq/B < 2.1, as a result, the transitions associated with 4T2g are used to find their luminescence properties. SnO2: Cr3+ is classified as an O-Cr-A type phosphor (Dq/B = 4.15, > 2.1) [42].
The Crystal Field (CF) and Zero-Field Splitting (ZFS) parameters for Cr3+ ions in SnO2 single crystals are determined using the Superposition Model (SPM). Calculations are performed using the interstitial site, distortion models, and Cr3+ ions in SnO2 crystal at Sn4+ ion sites. When distortion is included in the calculation, the calculated conventional ZFS values for the Cr3+ ion at Sn4+ sites in SnO2 single crystal give a reasonable accord with the experimental values. It is found that the Cr3+ ions in the SnO2 lattice replace the Sn4+ ions at those locations. The CF energy values for Cr3+ ions at Sn4+ sites calculated with CF parameters and the CFA program show an adequate degree of conformity with the experimental ones. Therefore, the theoretical inferences support the experimental result.
The modeling approach adopted in this work could prove useful in the future to find crystals for different industrial and scientific applications by correlating EPR and optical data for several other ion-host systems. The major usage of this investigation may be done in studies of Single Molecule Magnets (SMM), Single-Chain Magnets (SCM), and Single Ion Magnets (SIM) based on transition ions for computational modeling of their properties.
The CFA computer program was provided by Prof. C. Rudowicz of the Chemistry Faculty at A. Mickiewicz University in Poznan, Poland, for which the authors are grateful, and the department head of physics for the departmental facilities.
Bharati M, Singh V, Kripal R. Modeling of Cr3+ doped Cassiterite (SnO2) Single Crystals. IgMin Res. Jun 28, 2024; 2(6): 484-489. IgMin ID: igmin207; DOI:10.61927/igmin207; Available at: igmin.link/p207
1Department of Physics, Nehru Gram Bharti (DU), Jamunipur, Prayagraj, India
2EPR Laboratory, Department of Physics, University of Allahabad, Prayagraj-211002, India
Address Correspondence: Ram Kripal, EPR Laboratory, Department of Physics, University of Allahabad, Prayagraj-211002, India, Email: [email protected]
How to cite this article: Bharati M, Singh V, Kripal R. Modeling of Cr3+ doped Cassiterite (SnO2) Single Crystals. IgMin Res. Jun 28, 2024; 2(6): 484-489. IgMin ID: igmin207; DOI:10.61927/igmin207; Available at: igmin.link/p207


 スキャンしてリンクを取得