Welcome to IgMin Research – an Open Access journal uniting Biology, Medicine, and Engineering. We’re dedicated to advancing global knowledge and fostering collaboration across scientific fields.
Welcome to IgMin, a leading platform dedicated to enhancing knowledge dissemination and professional growth across multiple fields of science, technology, and the humanities. We believe in the power of open access, collaboration, and innovation. Our goal is to provide individuals and organizations with the tools they need to succeed in the global knowledge economy.
IgMin Publications Inc., Suite 102, West Hartford, CT - 06110, USA
Membrane processes have rapidly made their way into various fields and, in particular, in the treatment and reuse of municipal and industrial wastewater. However, membrane performance is drastically affected by fouling. In fact, as the filtration time increases, soluble materials and particulates are deposited on the membrane and inside the membrane, due to the interactions between the components of the activated sludge and the membrane.
In the microfiltration and ultrafiltration literature, there has been significant progress in understanding the fouling of individual components such as bacteria, yeasts, proteins, and colloids [1-4].
Much of this literature has focused on the effect of charging (via the change in pH or salt concentration), cross-flow, concentration, membrane hydrophilicity, membrane pore size, and flow (constant pressure and constant flow). Some general interactions of simple colloids are valid for macromolecules, the most commonly studied of which are proteins. Furthermore, the interaction between suspended colloids or those in the deposited “cake” in a mixed-species environment significantly changes the nature of the fouling layer in terms of strength and reversibility, even for simple model systems [5].
Due to the high organic load of wastewater, the acidic pH, and the presence of recalcitrant and toxic substances such as phenolic and lipid compounds, their production represents a serious environmental problem. On the other hand, vegetation water can be considered a source of compounds, which, if correctly separated and recovered, can be reused. Membrane technologies represent a possible green approach to the problem, instead of focusing on the destruction of phytotoxic compounds, it could be to look for alternative valorization mechanisms. Membrane systems are receiving increasing attention for water treatment. However, one of the major obstacles to the further incorporation of membrane processes into industrial operations is the decrease in flow resulting from fouling. Membrane replacement due to fouling represents the largest operating cost when membranes are used in water treatment applications.
Generally, two distinct types of fouling phenomena are considered: (1) macro solute adsorption, which refers to specific intermolecular interactions between the macro solute and the membrane, which occur even in the absence of filtration, and (2) macro solute or particle deposition induced by filtration, which is in addition to that observed in a static system [6].
This work is part of a larger one, which involves the use of combined membrane systems for the treatment of industrial wastewater. The goal is to recover clean water and some of the compounds dissolved in the drain. A screening of different membrane materials is carried out to evaluate irreversible fouling. The membranes exhibited different surface morphological properties in terms of pore size, porosity, and roughness. The autopsy of the membrane and the analysis of the adsorbed components allow us to identify the fouling mechanisms and the possible strategies for the functionalization of the membrane to obtain antifouling surface properties.
To study the fouling mechanism of membranes due to vegetation water, all these membrane properties were investigated: pore size, hydrophobicity, pore size distribution, roughness, and membrane material.
In an aqueous environment, a membrane can be attractive or repulsive to water. The composition of the membrane and the corresponding surface chemistry determine its interaction with water, thus influencing its wettability. Membrane wettability can be determined by measuring the contact angle between the membrane surface and a drop of liquid. Hydrophilic membranes are characterized by the presence of active groups that can form hydrogen bonds with water and therefore these membranes have wettability. Hydrophobic membranes have the opposite interaction with water compared to hydrophilic membranes as they have little or no tendency to absorb water and water tends to form droplets on their surfaces (i.e. discrete droplets). This tends to increase fouling. Hydrophobic membranes possess low wettability due to the lack of active groups on their surface for forming hydrogen bonds with water. Particles that foul membranes in aqueous media tend to be hydrophobic. They tend to clump or clump together to form colloidal particles because this process lowers the interfacial free energy. Usually, a higher charge density on the membrane surface is associated with a higher hydrophilicity of the membrane. Therefore, fouling can be reduced with the use of membranes made hydrophilic with surface modifications.
Membrane morphology also has a considerable effect on fouling, such as pore size, pore size distribution, and pore geometry, especially on the membrane surface. This leads to predominant fouling mechanisms such as pore blockage and cake formation. The properties of the feed solution also significantly influence membrane fouling [7].
Solution properties such as concentration of solids (particles), particle size and nature of components, and operating conditions (pH, temperature, flow rate, and pressure) also play a fundamental role in the study of the membrane process and its goodness.
This mini paper focuses on the morphological study of the fouling of some commercial membranes with an industrial feed rich in organic substances and on the possibility of recovering not only clean water and dissolved waste substances but also the membrane itself.
Three different flat commercial membranes were chosen for this study. Polyvinylidene fluoride (PVDF) and polysulfone (PS) membranes, supported on polypropylene (PP), with different pore sizes, asymmetric structure, and wide operating pH range, were supplied by Alfa Laval (Soborg, Denmark).
The characteristics of the membranes are summarized in Table 1.
Table 1: Specification of used membranes.
Material
Pore size, mm
Support
Ph range
Structure
Manufacturer
PVDF
0.5
PP
1-11
Asymmetric
Alfa Laval
PVDF
0.2
PP
1-11
Asymmetric
Alfa Laval
PS
0.2
PP
1-11
Asymmetric
Alfa Laval
Membrane fouling is defined as permeate flux decline due to the accumulation of substances within membrane pores and/or onto the membrane surface.
The basis parameter to estimate membrane fouling is the flux to clean water (J0), according to the equation:
(1)
Where ηT and η20°C are water viscosity at room temperature and 20 °C, respectively, Q is the clean water flux at temperature T, A is the membrane surface area and ∆P is the transmembrane pressure.
Clean water flux (Jf) after the filtration process was measured and its value was used to determine the flux reduction (FR), according to the equation:
(2)
Determining FR for all tested membranes it is possible to compare different membrane materials performances on the same feed and also to evaluate membrane cleaning efficiencies.
After filtration membranes were washed with distilled water (DI) and Jf was determined to calculate FR, due to fouling adhesion.
To limit the fouling process during the adhesion phase, the membranes were placed in direct contact with the IWW, immersing them at different times in a beaker. In this way, pressure is not generated on the surface of the membrane, which would contribute to the formation of encrustations during the filtration of the feed. After 4 hours of immersion, a constant flow is achieved for all membranes.
Atomic Force Microscopy (AFM), and Nanoscope IIIA (Digital Instruments, VEECO Metrology Group) were used to observe surface morphology and to measure surface roughness both of new and used membranes. Tapping ModeTM AFM operated by scanning a tip attached to the end of an oscillating cantilever across the sample surface. The cantilever was oscillated at or near its resonance frequency with an amplitude ranging typically from 20 to 100 nm. Silicon probes were used. These probes can be much stiffer than the silicon nitride ones, resulting in larger force constants and resonance frequencies. Characteristics of the used silicon probes are resonance frequency 200-400 kHz, Nominal Tip Radius of Curvature 5 nm - 10 nm and Cantilever Length 125 mm.
Surface roughness was estimated concerning the mean absolute value difference, Ra, and the root mean squared difference, Rq, between the actual surface height and that of the line dividing the surface of the investigated profile into two equal areas. Ra and Rq were calculated from the equations:
(3)
(4)
Each of the formulas assumes that the roughness profile has been filtered from the raw profile data and the mean line has been calculated. The roughness profile contains ordered, equally spaced points along the trace, and is the vertical distance from the mean line to the data point. Height is assumed to be positive in the up direction, away from the bulk material.
The reported roughness values are the average of 30 measurements on different membrane samples.
A decrease in permeate flux of size exclusion membranes may be characterized by two different processes: short-term rapid flux decline due to pore blocking and cake formation, and long-term gradual flux decline due to cake compaction and irreversible fouling [8].
In general, the growth of the cake layer is proportional to foulant flux entering the cake layer which is a function of foulant concentration and permeate flow. In any case, this happens during filtration tests, with some transmembrane pressure applied. The goal of this work is to study the fouling behavior of membranes in static conditions, using IWW as waste. IWW beaker is the easiest system to investigate the fouling adhesion on the membrane surface because it allows investigating fouling interaction on the membrane surface avoiding the filtration through the membrane pore causing other fouling phenomena.
The flux decline is lower for PVDF 0.5 mm membrane, due to larger pore size. PVDF 0.2 mm membrane, made of the same material, shows a higher FR value. FR data for the IWW beaker test on PS 0.2 mm results lower than PVDF 0.2 mm membrane. In this case, the membranes tested were not made of the same material, but their pore size was the same.
The effects of pore size on membrane fouling are strongly related to the characteristics of the feed solution and in particular the particle size distribution. Depending on the size of the pores and the type of feed, the results reported in the literature have shown opposite trends. If the particle size is smaller than the pore size, pore blockage and/or restriction is expected. Membranes with large pores are therefore expected to have a greater propensity to fouling than those with smaller pores. Pore size alone cannot predict hydraulic performance, as no general trend was observed between these two parameters. However, testing membranes with pores between 0.4 and 5 µm, Gander, et al. [9] observed opposite results, i.e., greater initial fouling for large pores and a significant decrease in flux when small-pore membranes were used for an extended period.
Due to the hydrophobic interactions that occur between solutes and the membrane material, membrane fouling is expected to be more severe with hydrophobic rather than hydrophilic membranes [10]. The hydrophobic character of the PDVF compared to the PS membrane may explain the tendency towards reduced flux recorded in the beaker tests. For the same material, fouling is more pronounced by decreasing the pore size of the membrane, and PVDF and PS membranes with the same pore size have similar performance, but PVDF shows higher flux reduction values.
The focus of the work is the morphological analysis of the membranes at different immersion times in wastewater, to investigate the surface morphology, which plays an important role in the fouling process. In particular, morphological visualization was realized and membrane roughness at different test times was measured. AFM analysis was carried out for PVDF 0.5, PVDF 0.2, and PS 0.2 mm membranes. All the topographical images are on an area of 5x5 mm2.
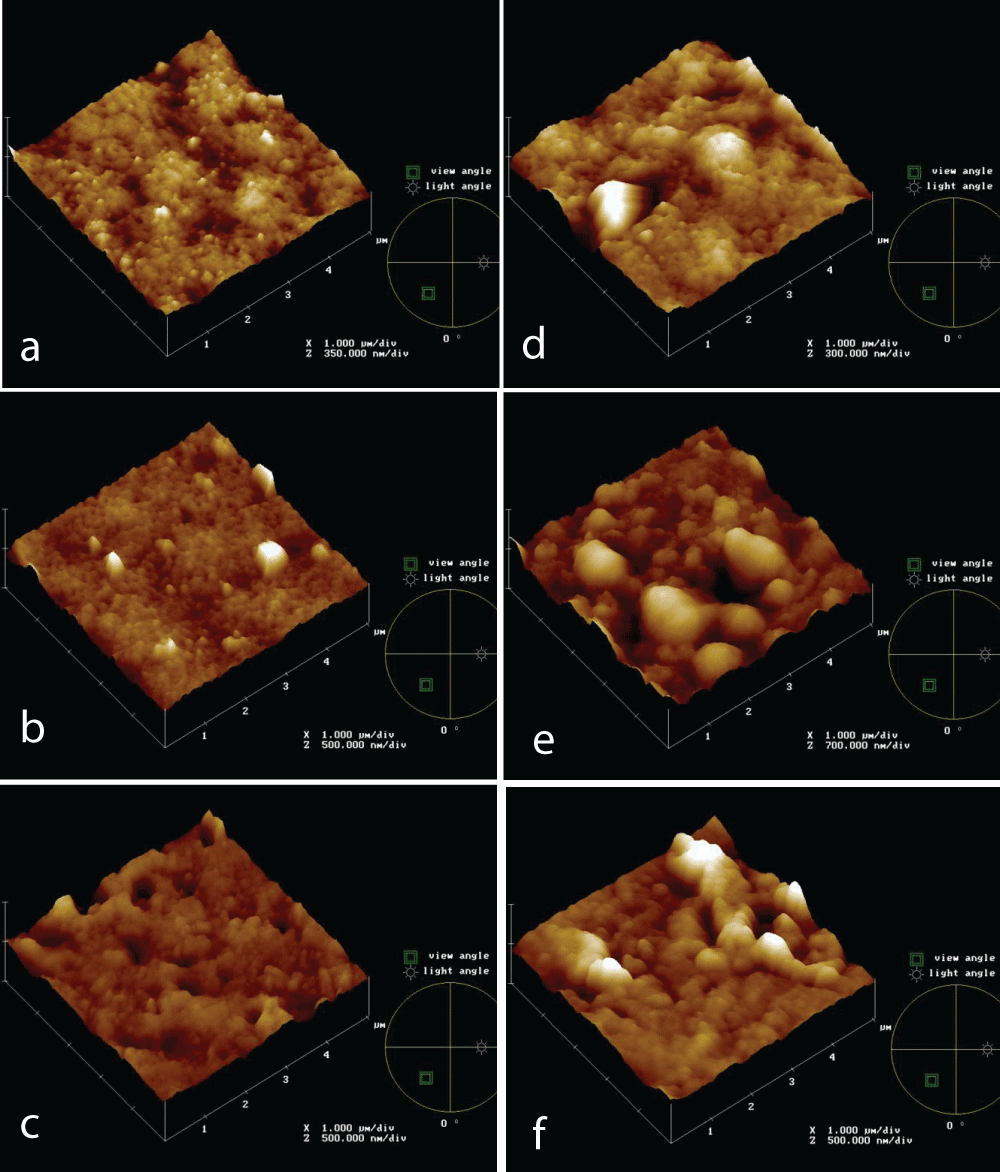
Morphology and roughness affect fouling formation. Figure 1 shows topographies of new PVDF 0.5 mm (a), PVDF 0.2 mm (b), and PS 0.2 mm (c) membranes after 4h of immersion test in the IWW beaker (d,e,f, respectively. Both PVDF 0.2 mm and PS 0.2 mm membranes seem to be more affected by fouling phenomena, concerning PVDF 0.5 mm.
Figure 1: AFM topographies of new and after 4h in the IWW beaker PVDF 0.5 mm (a, d, respectively), PVDF 0.2 mm (b, d, respectively), PS 0.2 mm (c, f, respectively) membranes.
During filtration tests, membrane morphology, and pore size were changing simultaneously, so it is not possible to determine the effect of roughness on fouling. The tests were performed in static conditions and AFM analyses were carried out to follow the fouling process on different membranes, made of the same material, but with different pores size, and made of different materials, but with the same pore size; in particular PVDF 0.5 and 0.2 mm and PS 0.2 mm membranes. The membranes were analyzed also in terms of roughness.
The roughness of PVDF 0.5 mm and 0.2 mm and PS 0.2 mm, both new and after 4 hours of use in the IWW beaker, was measured (Table 2). After a 4h immersion test, PVDF 0.2 mm reaches a higher roughness value, followed by PVDF 0.2 mm and PVDF 0.5 mm remains the smoother membrane, according to FR% data (not here reported). The data show a roughness trend of increasing roughness from PVDF 0.5, passing through PS 0.2, up to PVDF 0.2 mm, according to literature data. It is reported [11] that the large “filling-in points” present on rougher membranes are more prone to the creation of fouling layers, compared to the fewer and smaller “crevices” observed on smoother membranes.
Table 2: Roughness measurements of new and used PVDF 0.5 mm, PVDF 0.2 mm and PS 0.2 mm membranes.
Membrane
Ra, nm ± St. Dev
Rq, nm ± St. Dev.
new
4h used
new
4h used
PVDF 0.5 mm
12.4 ± 2.7
14.7 ± 8.1
15.9 ± 3.6
18.4 ± 9.4
PVDF 0.2 mm
16.4 ± 9.3
48.6 ± 14.2
21.7 ± 11.4
60.5 ± 17.0
PS 0.2 mm
20.5 ± 6.9
30.1 ± 19.1
26.1 ± 8.4
38.3 ± 23.6
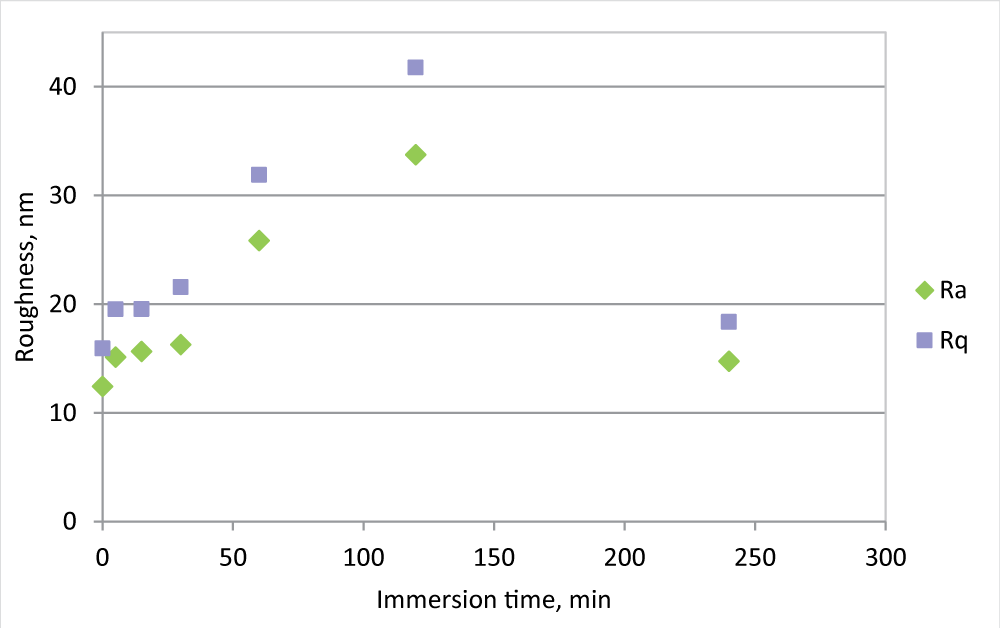
During fouling formation, morphology and roughness changes and roughness analysis may give some information about fouling formation. To evaluate this aspect, the roughness measurements for the PVDF 0.5 mm membrane have also been carried out at the intermediate time of immersion in the beaker, 5, 15, 30, 60, 120, and 240 minutes (Figure 2).
Figure 2: Ra and Rq measurement for PVDF 0.5 mm membrane, new and in the IWW beaker for different times.
Following the evolution of the roughness in the time, it is clear that in the first minutes of immersion, the roughness greatly increases, reaches its maximum after 2 hours of immersion, and then decreases, to arrive at a value not much different from the initial one. At the same time, the flux is strongly reduced, but the difference in FR % between 2 and 4 hours is not so marked as roughness. This fact may be explained by an initial fouling formation that affects the pores, while in time the cake formation allows an increase of resistance, but also to a membrane surface smoothing.
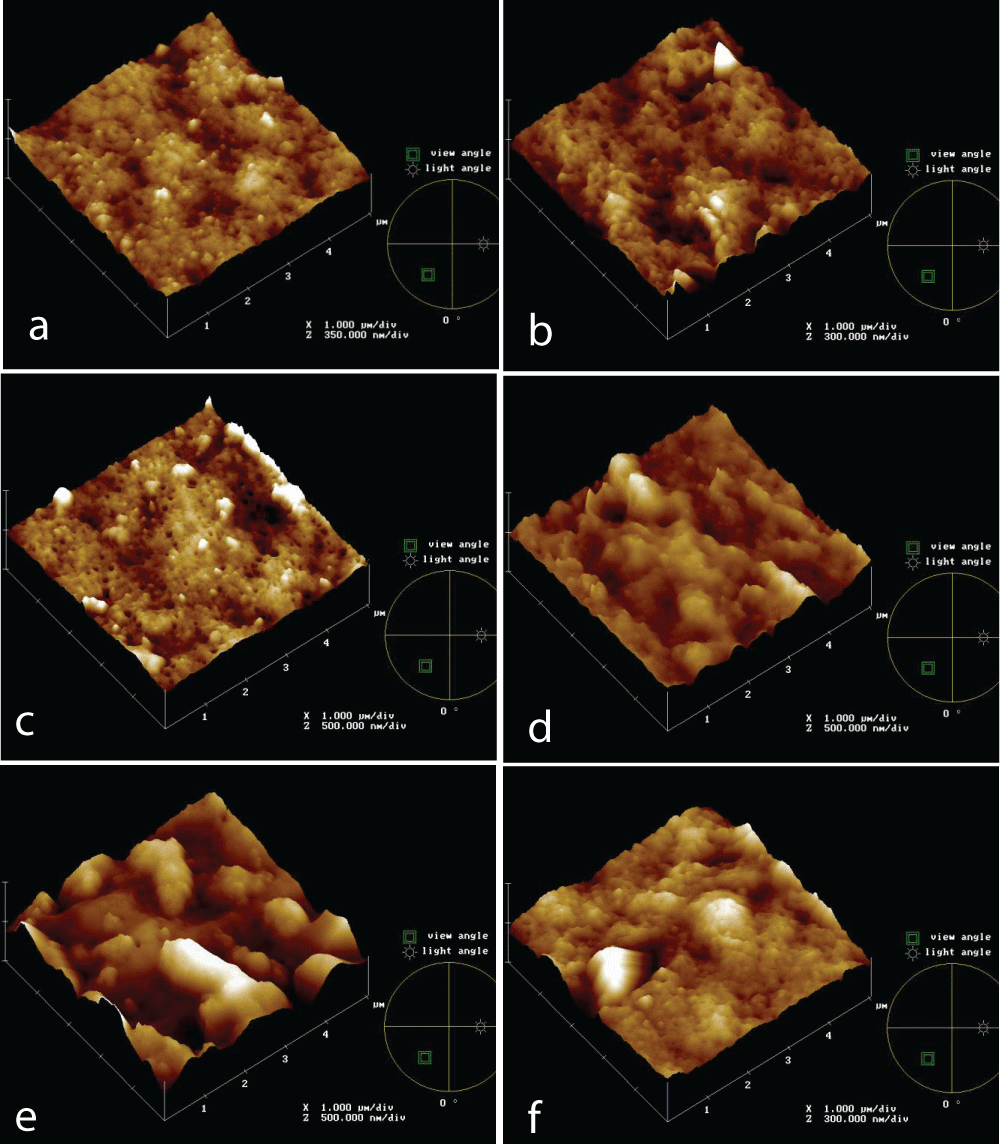
Topographical images of PVDF 0.5 mm membrane at different times (0, 5’, 30’, 60’, 2h, 4h) of the IWW beaker immersion test are reported in Figures 3a-e.
It’s clear from the images that the membrane surface is affected by fouling, because of the appearance of some elements higher on the basis surface and this is progressive up to 30’ test. In Figure 3d it seems that something else was rubbed on membranes and morphology changes, up to Figure 3e, in which both of the previous foulant aspects are present and a cake is formed on the membrane surface. This offers an additional resistance for filtration, but no further flux reduction happens, as shown before, and it results in a lower roughness value, according to Table 2 data.
Figure 3: AFM topographies of PVDF 0.5 mm membrane new (a) and at different times of IWW beaker immersion test: 5’ (b), 30’ (c), 60’ (d), 2h (e), 4h (f).
PVDF and PS commercial membranes, also with different pore sizes, were tested to evaluate the fouling mechanism throw Industrial Wastewater.
To evaluate only the interaction between membrane surface and fouling, the best way to assess this interaction is the result of immersion of the membranes in a beaker with raw water. The results suggest a great interaction between low pore-size membranes of hydrophobic material and IWW fouling. Different membranes with the same pore size show little fouling difference, due to different hydrophobicity and probably pore size distribution. Higher initial fouling for large pores and significant flux decline when the small pore membranes were used over an extended period were registered. Best performances were obtained with PVDF 0.5 mm membrane.
AFM analysis confirmed the PVDF 0.5 mm membrane shows the best performance and showed fouling-making related to roughness value in the time. For the PVDF 0.5 mm membrane, which had the largest pore size among all tested membranes, the flux decline is lower. This suggests a strong interaction between the fouling and the pore size. The decrease of the membrane performance is pronounced for PVDF 0.2 mm than the PVDF 0.5 mm membrane. Even if the same pore size, it results that PVDF 0.2 mm shows a higher FR% and also a higher surface roughness, after 4 hours of immersion, concerning PS 0.2 mm.
To limit the surface-fouling interaction and use PVDF membranes, a chemical modification of the membrane surface may be performed. PVDF material ensures better chemical and mechanical resistance during the process. A modification of the membrane surface to improve the membrane surface hydrophilicity would limit the interactions between surface and fouling, as from the data obtained was observed hydrophobic behavior of fouling.
Preliminary results suggest the possibility of washing the membranes used, restoring the initial flow. This could favor the use of membrane technology, also from an economic point of view. Further tests are underway.
Address Correspondence: Gordano A, Research Institute on Membrane Technology, ITM-CNR, V. P. Bucci cubo 17/C I-87030, Italy, Email: [email protected]
How to cite this article: Gordano A. AFM Analysis of Polymeric Membranes Fouling. IgMin Res. May 29, 2024; 2(5): 399-405. IgMin ID: igmin192; DOI: 10.61927/igmin192; Available at: igmin.link/p192


 スキャンしてリンクを取得